Posts tagged radar
Investigating ARM Scanning Cloud Radar Data from EPCAPE
- 21 March 2024
We would like to find data from a relevant case, and visualize using Py-ART!
Include a walk through of the solution, with some sort of final figure or notable insight!
Blending Observations from TRACER using Py-ART
- 21 October 2022
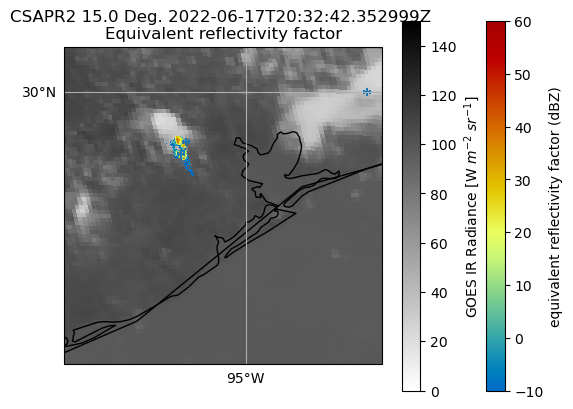
The TRacking Aerosol Convection Interactions (TRACER) field experiment was a U.S. Department of Energy IOP with the goal of studying the lifecycle of convection over Houston as well as potential aerosol impacts on this lifecycle. Houston is uniquely suited for this kind of field experiment where seabreeze convection forms off of the coast of Houston in cleaner air conditions and then approaches the more polluted Houston region. For more information about the TRACER field experiment, click here.
This post will show how to plot overlays of Texas A&M University Lightning Mapping Array data over GOES and ARM CSAPR2 data for a case of wildfire smoke entraining into developing convection sampled during July 12 and 13, 2022. In addition, we highlight a case that was tracked by CSAPR2 for 90 minutes on June 17, 2022.