Here are examples on how to use PySP2.
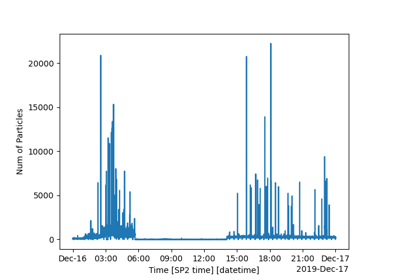
Example for plotting number of particles in housekeeping data
Example for plotting number of particles in housekeeping data

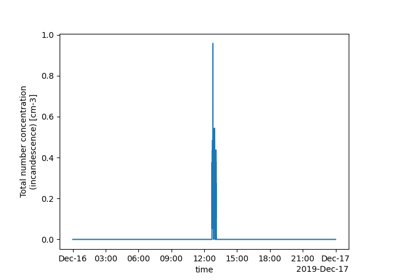
Example on plotting particle concentration data timeseries
Example on plotting particle concentration data timeseries