Note
Go to the end to download the full example code.
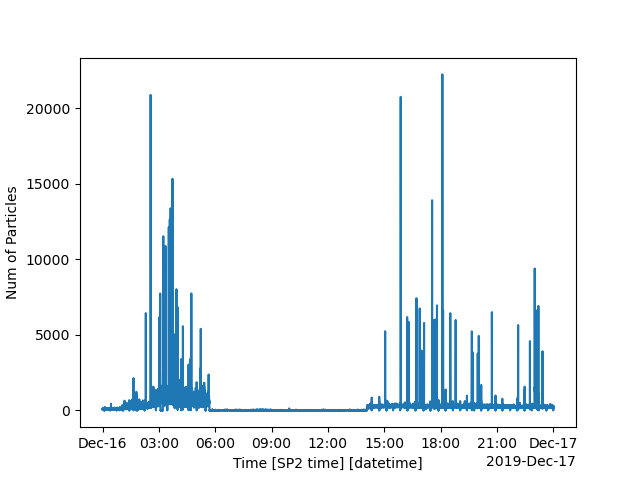
Example for plotting number of particles in housekeeping data#

<xarray.Dataset> Size: 32MB
Dimensions:                    (time: 86400)
Coordinates:
  * time                       (time) datetime64[ns] 691kB 2019-12-16T00:00:0...
Data variables: (12/46)
    Time                       (time) float64 691kB 0.609 1.622 ... 8.64e+04
    Sample Flow LFE            (time) float64 691kB 119.7 120.3 ... 119.2 121.0
    YAG Power                  (time) float64 691kB 5.15 5.279 ... 5.166 5.214
    Incand. Conc.              (time) float64 691kB 6.449 4.512 ... 7.94 10.06
    Sheath Flow Read           (time) float64 691kB 1.006e+03 ... 1e+03
    YAG Crystal Temp           (time) float64 691kB 28.59 28.66 ... 28.69 28.52
    ...                         ...
    Num of Particles           (time) int64 691kB 73 56 53 56 ... 203 241 214
    Num Written to File        (time) int64 691kB 73 56 53 56 ... 203 241 214
    Num in File                (time) int64 691kB 40 96 149 ... 23408 23622
    Laser Power Switch         (time) int64 691kB 1 1 1 1 1 1 1 ... 1 1 1 1 1 1
    Sample Pump Power Switch   (time) int64 691kB 1 1 1 1 1 1 1 ... 1 1 1 1 1 1
    Laser Temp                 (time) float64 691kB 0.9572 0.9572 ... 0.9572
Attributes:
    _datastream:          mosaossp2auxM1.00
    _site:                mos
    _arm_standards_flag:  0
import pysp2
import matplotlib.pyplot as plt

my_hk = pysp2.io.read_hk_file(pysp2.testing.EXAMPLE_HK)
print(my_hk)
# my_hk is a standard xarray dataset, so one can use xarray's plotting
# capabilities in order to make the plot
my_hk['Num of Particles'].plot()
plt.show()
Total running time of the script: (0 minutes 2.968 seconds)