Note
Go to the end to download the full example code.
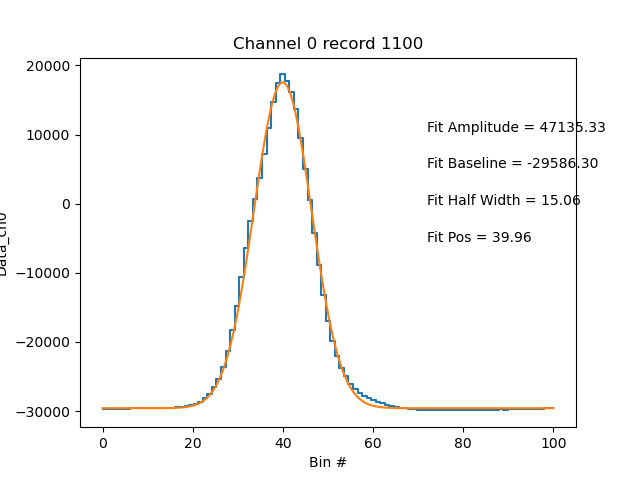
Example for plotting a wave in a .sp2b file#

/home/runner/work/PySP2/PySP2/pysp2/util/peak_fit.py:469: RuntimeWarning: divide by zero encountered in divide
  peak2area = np.max(data2, axis=1)/denominator
Processing record 0
/home/runner/work/PySP2/PySP2/pysp2/util/peak_fit.py:383: OptimizeWarning: Covariance of the parameters could not be estimated
  coeff, var_matrix = curve_fit(_gaus, bins_fit, data_fit, p0=p0, method='lm', maxfev=40, ftol=1e-3)
/home/runner/work/PySP2/PySP2/pysp2/util/peak_fit.py:563: OptimizeWarning: Covariance of the parameters could not be estimated
  coeff, var_matrix = curve_fit(_gaus, bins_fit, temp1_fit, p0=p0, method='lm', maxfev=50, ftol=1e-3)
Processing record 1000
Processing record 2000
Processing record 3000
Processing record 4000
Processing record 5000
/home/runner/work/PySP2/PySP2/pysp2/util/peak_fit.py:78: RuntimeWarning: Mean of empty slice
  ratio = np.nanmean(
5877 records processed in 5.951277494430542 s
<xarray.Dataset> Size: 41MB
Dimensions:               (event_index: 5877, columns: 100)
Dimensions without coordinates: event_index, columns
Data variables: (12/83)
    time                  (event_index) datetime64[ns] 47kB 2019-12-16T12:42:...
    Flag                  (event_index) int16 12kB 16 16 23 16 ... 16 16 2329
    Res1                  (event_index) float32 24kB 0.0 0.0 0.0 ... 0.0 0.0 0.0
    Res5                  (event_index) float32 24kB 1.0 1.0 1.0 ... 1.0 1.0 1.0
    Res6                  (event_index) float32 24kB 1.0 1.0 1.0 ... 1.0 1.0 1.0
    Res7                  (event_index) float64 47kB 0.0 0.0 0.0 ... 0.0 0.0 0.0
    ...                    ...
    IncanRatioch1ch2      (event_index) float64 47kB 1.261 nan ... -1.36 -0.1407
    IncanRatioch5ch6      (event_index) float64 47kB nan nan ... 0.7619 17.5
    ScatRejectKey         (event_index) int64 47kB 0 0 3 0 0 3 0 ... 3 0 3 0 1 1
    IncanRejectKey        (event_index) int64 47kB 2 2 3 2 2 2 2 ... 2 2 2 2 2 2
    OneofEvery            (event_index) float64 47kB 1.0 1.0 1.0 ... 1.0 1.0 1.0
    DeadtimeRelativeBias  (event_index) float64 47kB -0.0002 ... -0.00015
/home/runner/micromamba/envs/pysp2-docs/lib/python3.14/site-packages/act/plotting/plot.py:81: UserWarning: Could not discern datastreamname and dict or tuple were not provided. Using defaultname of act_datastream!
  warnings.warn(
import pysp2
import matplotlib.pyplot as plt

my_sp2 = pysp2.io.read_sp2(pysp2.testing.EXAMPLE_SP2B)
my_config = pysp2.io.read_config(pysp2.testing.EXAMPLE_INI)
my_sp2 = pysp2.util.gaussian_fit(my_sp2, my_config)
print(my_sp2)
pysp2.vis.plot_wave(my_sp2, 1100, 0)
plt.show()
Total running time of the script: (0 minutes 6.443 seconds)