Note
Go to the end to download the full example code.
Example for plotting selected variables from a SP2-XR housekeeping file#
<xarray.Dataset> Size: 17MB
Dimensions:                                       (time: 20650)
Coordinates:
  * time                                          (time) datetime64[us] 165kB ...
Data variables: (12/99)
    Time Stamp                                    (time) object 165kB '05/08/...
    Time                                          (time) float64 165kB 2.395e...
    Time Stamp (UTC sec)                          (time) float64 165kB 3.64e+...
    Elapsed Time                                  (time) float64 165kB 2.371e...
    Error Code                                    (time) int64 165kB 0 0 ... 0 0
    Packet Time Stamp                             (time) float64 165kB 2.371e...
    ...                                            ...
    Laser Current Set Point                       (time) float64 165kB 1.9 .....
    Spare 4 Set Point                             (time) int64 165kB 0 0 ... 0 0
    Spare 5 Set Point                             (time) int64 165kB 0 0 ... 0 0
    PMT HV Set Point                              (time) float64 165kB 0.46 ....
    Particle Density                              (time) float64 165kB 1.8 .....
    PbP Packet Time                               (time) float64 165kB 2.395e...
Attributes:
    _datastream:                  SP2XR_hk_20190508172218_x0001.zip
    _site:                        SP2
    _arm_standards_flag:          0
    ScatCalibrationFile:          /home/runner/work/PySP2/PySP2/pysp2/testing...
    ScatCalibration_Diameter_nm:  [100.    121.053 142.105 163.158 184.211 20...
    ScatCalibration_Signal:       [3.61e+04 1.10e+05 2.81e+05 6.30e+05 1.28e+...
    IncanCalibrationFile:         /home/runner/work/PySP2/PySP2/pysp2/testing...
    IncanCalibration_Mass_fg:     [5.00000e-02 5.20526e+00 1.03605e+01 1.5515...
    IncanCalibration_Signal:      [5.07e+04 3.26e+07 6.88e+07 1.07e+08 1.47e+...
import pysp2
import matplotlib.pyplot as plt

my_hk = pysp2.io.read_sp2xr_hk_file(pysp2.testing.EXAMPLE_SP2XR_HK)
print(my_hk)

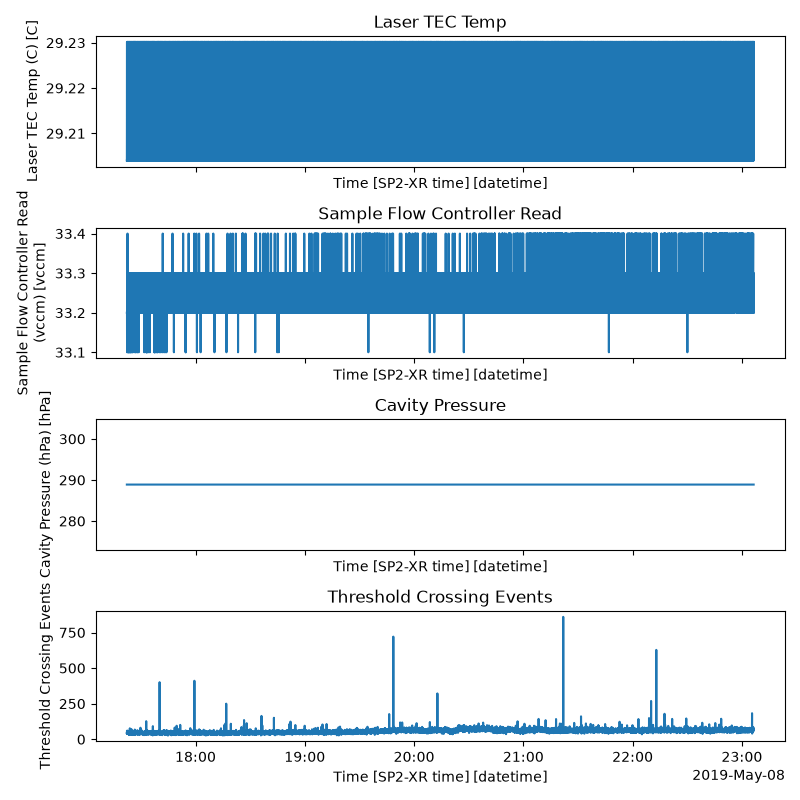
# A few representative housekeeping channels: temperature, flow, pressure,
# and particle event count
variables = [
    'Laser TEC Temp',
    'Sample Flow Controller Read',
    'Cavity Pressure',
    'Threshold Crossing Events',
]

fig, axes = plt.subplots(len(variables), 1, sharex=True, figsize=(8, 8))
for ax, var in zip(axes, variables):
    my_hk[var].plot(ax=ax)
    ax.set_title(var)
plt.tight_layout()
plt.show()
Total running time of the script: (0 minutes 1.904 seconds)