Note
Go to the end to download the full example code.
Example for plotting a waveform in a SP2-XR .sp2b file#
<xarray.Dataset> Size: 15MB
Dimensions:          (event_index: 457, columns: 4096)
Dimensions without coordinates: event_index, columns
Data variables:
    time             (event_index) datetime64[us] 4kB 2019-05-08T17:22:18.407...
    Flag             (event_index) int32 2kB 0 0 0 0 0 0 0 0 ... 0 0 0 0 0 0 0 0
    Res1             (event_index) float32 2kB 0.0 0.0 0.0 0.0 ... 0.0 0.0 0.0
    Res5             (event_index) float32 2kB 0.0 0.0 0.0 0.0 ... 0.0 0.0 0.0
    Res6             (event_index) float32 2kB 0.0 0.0 0.0 0.0 ... 0.0 0.0 0.0
    Res7             (event_index) float64 4kB 0.0 0.0 0.0 0.0 ... 0.0 0.0 0.0
    Res8             (event_index) float64 4kB 0.0 0.0 0.0 0.0 ... 0.0 0.0 0.0
    EventIndex       (event_index) float32 2kB 0.0 0.0 0.0 0.0 ... 0.0 0.0 0.0
    DateTimeWaveUTC  (event_index) float64 4kB 3.64e+09 3.64e+09 ... 3.64e+09
    TimeWave         (event_index) float32 2kB 2.371e+06 2.371e+06 ... 2.371e+06
    Data_ch0         (event_index, columns) int32 7MB -396 -658 -790 ... 0 0 0
    Data_ch1         (event_index, columns) int32 7MB -2464 -1984 -1984 ... 0 0
import pysp2
import matplotlib.pyplot as plt

my_sp2xr = pysp2.io.read_sp2xr(pysp2.testing.EXAMPLE_SP2XR_SP2B)
print(my_sp2xr)

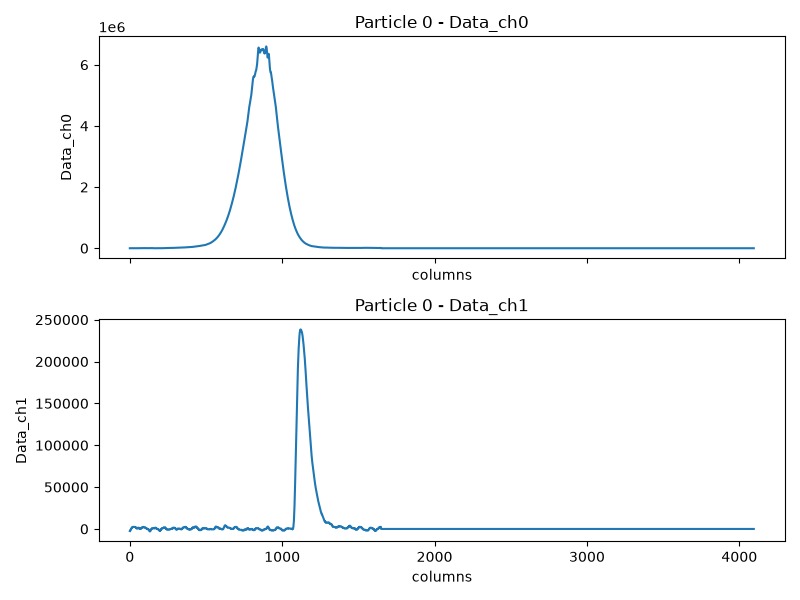
# Plot ch0 and ch1 waveforms for the first particle
fig, (ax0, ax1) = plt.subplots(2, 1, sharex=True, figsize=(8, 6))
my_sp2xr['Data_ch0'].isel(event_index=0).plot(ax=ax0)
ax0.set_title('Particle 0 - Data_ch0')
my_sp2xr['Data_ch1'].isel(event_index=0).plot(ax=ax1)
ax1.set_title('Particle 0 - Data_ch1')
plt.tight_layout()
plt.show()
Total running time of the script: (0 minutes 0.334 seconds)