Posts by Max Grover
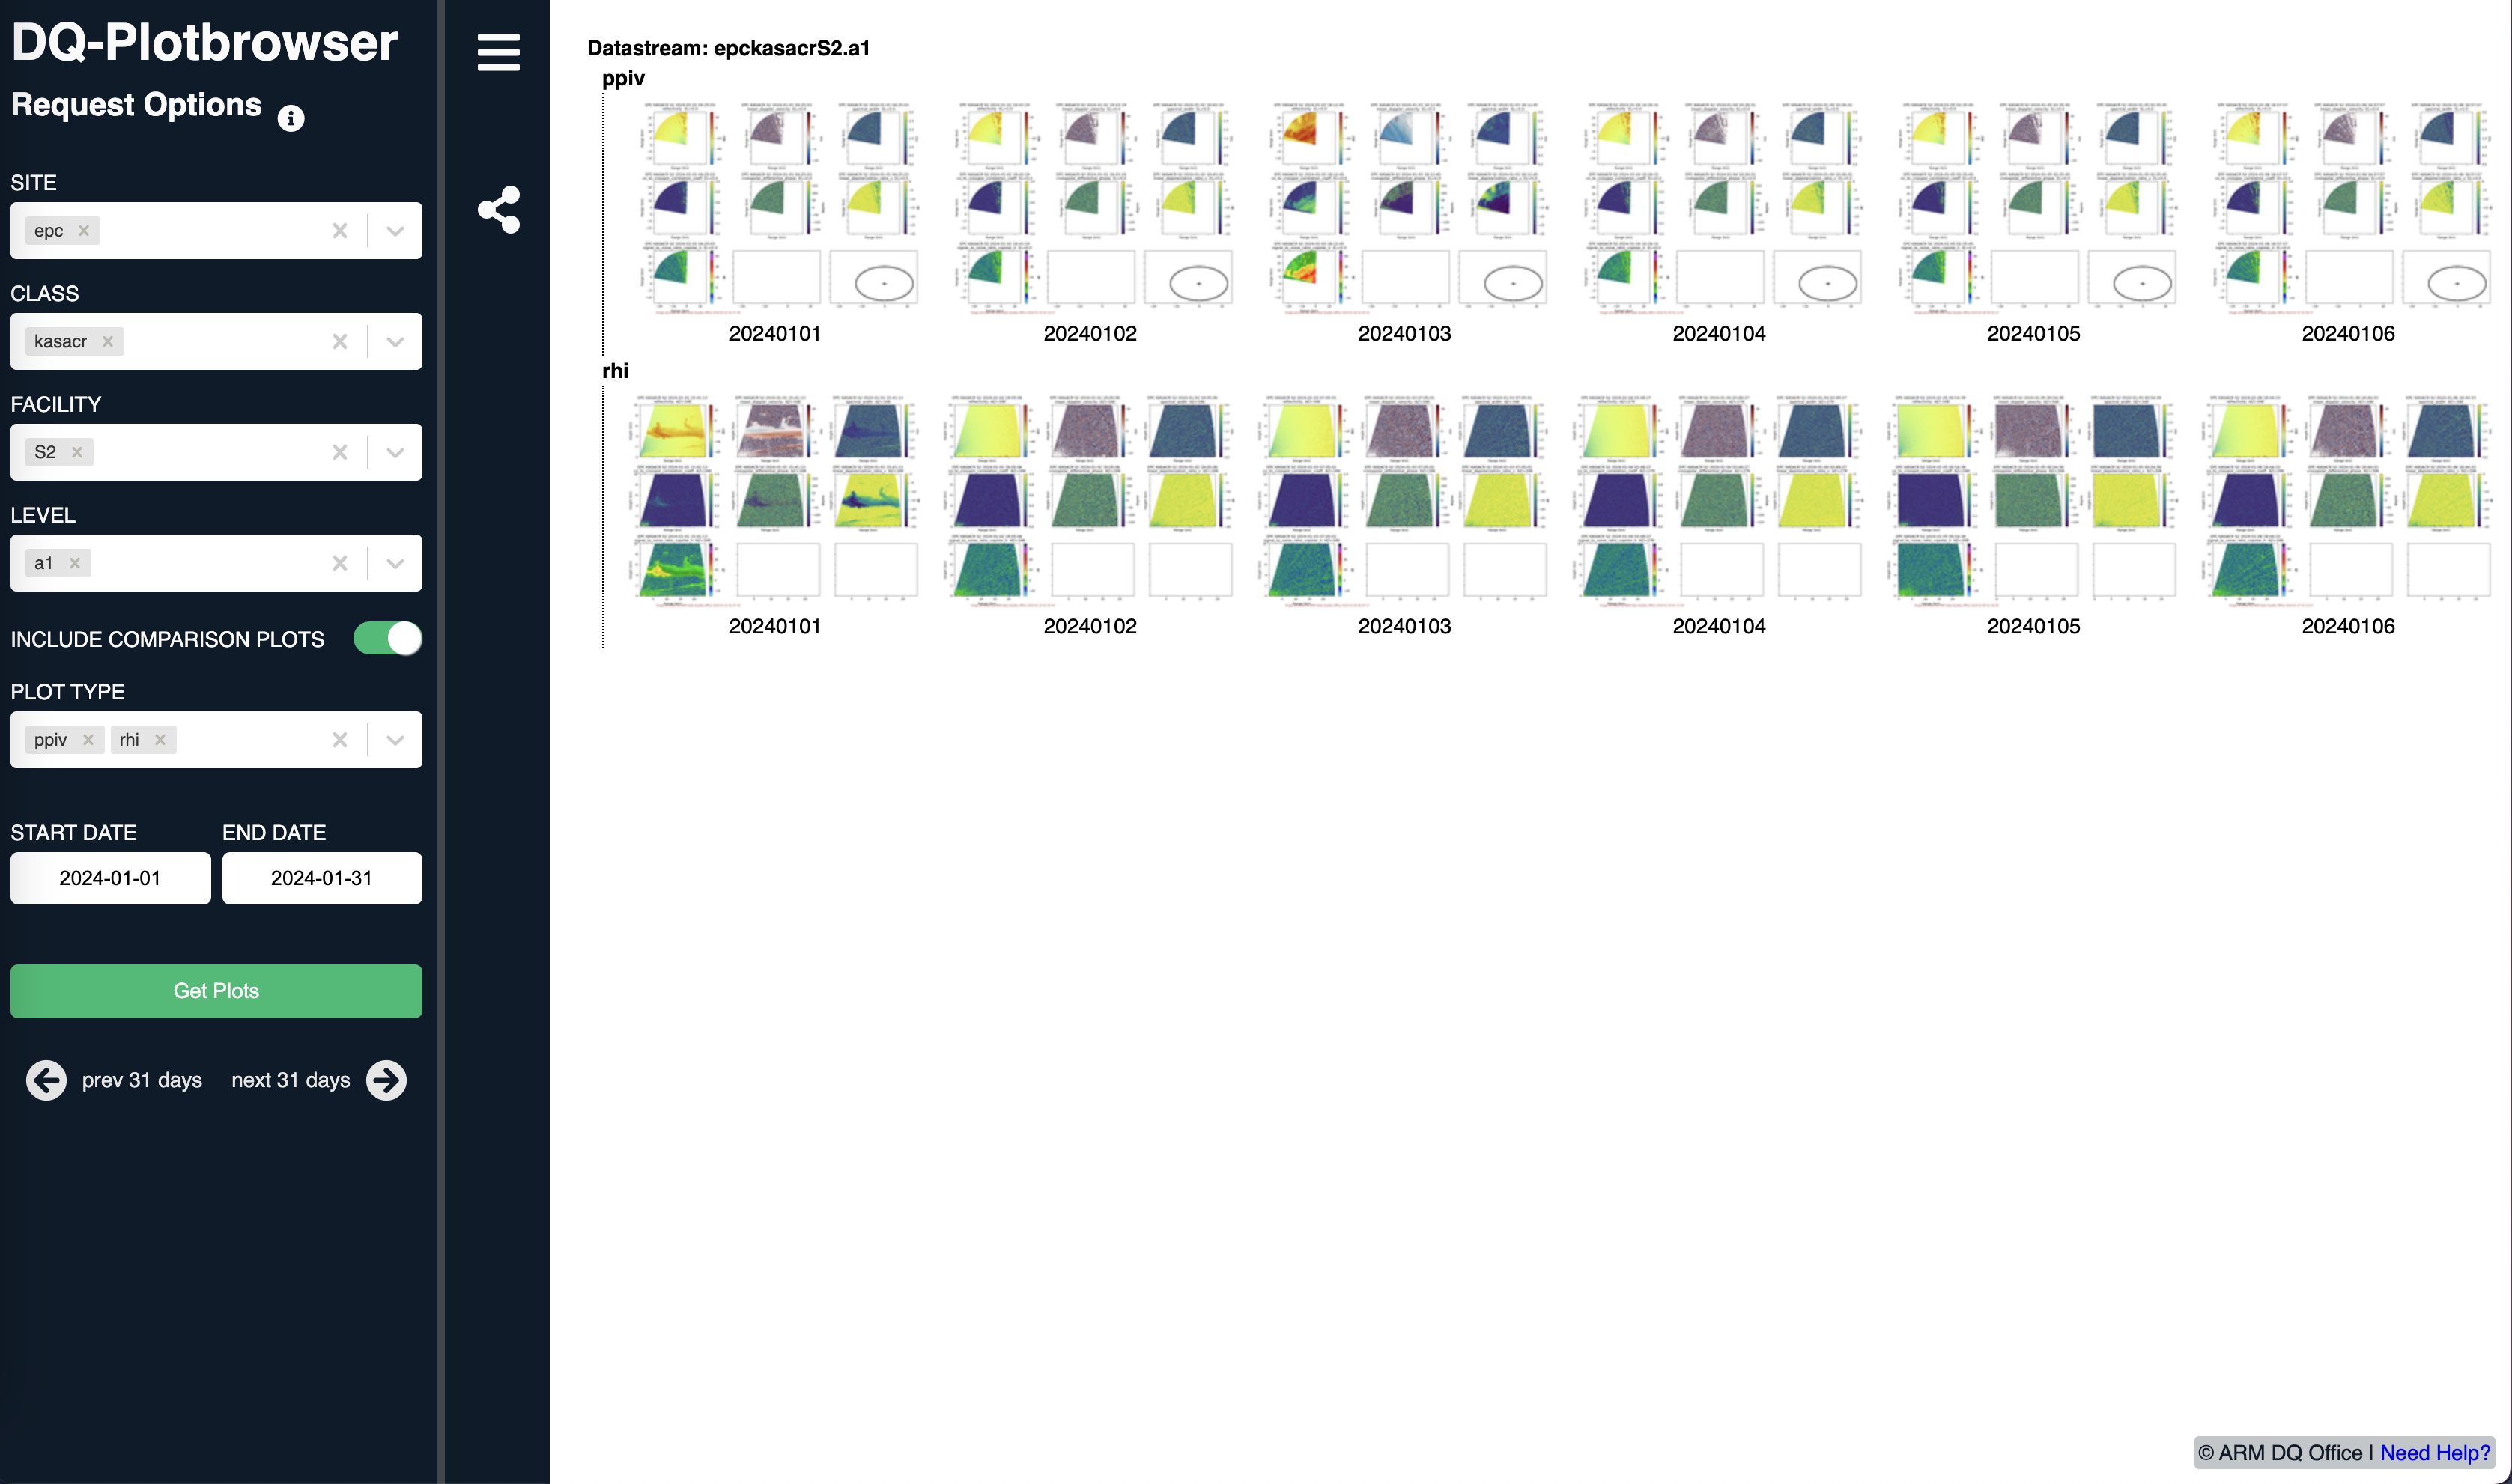
Investigating ARM Scanning Cloud Radar Data from EPCAPE
- 21 March 2024
We would like to find data from a relevant case, and visualize using Py-ART!
Include a walk through of the solution, with some sort of final figure or notable insight!
Plotting Severe Weather in Wisconsin
- 07 April 2023
Last Friday (March 31, 2023), a severe weather outbreak impacted a large portion of the Central United States, including the Upper Midwest. There were a total of:
142 tornado reports
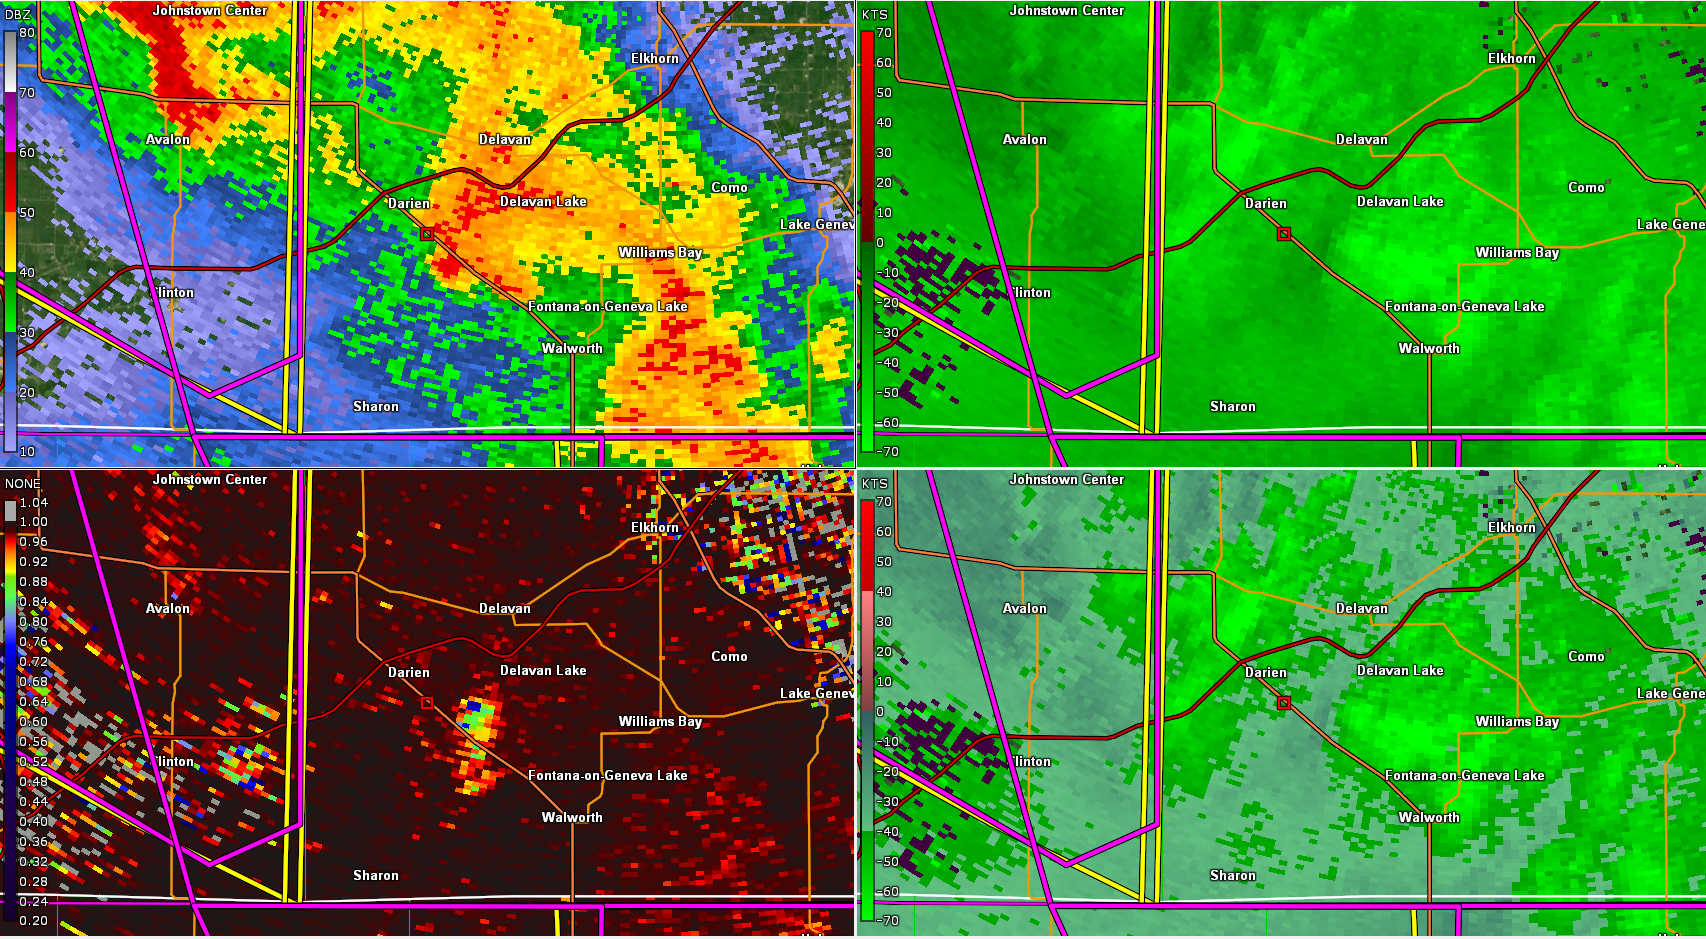
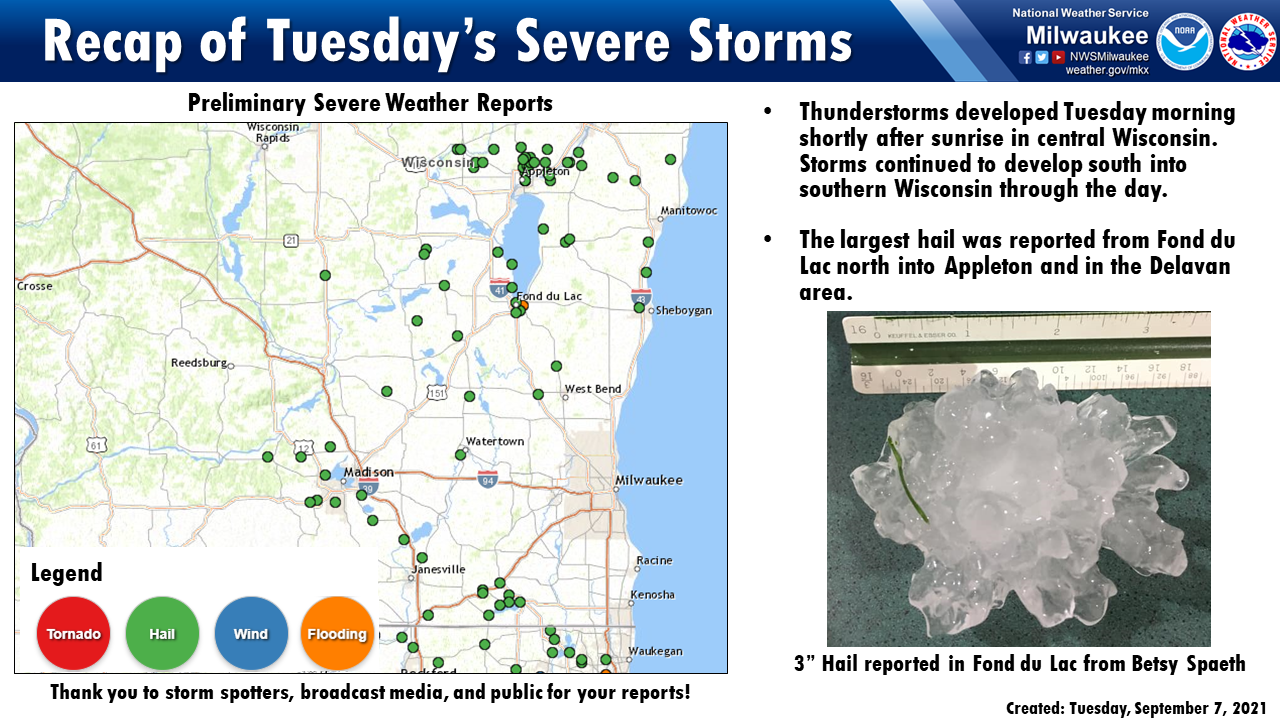
Hail Storm Visualization Using Py-ART and Pandas!
- 23 November 2022
Within this post, we will walk through how to combine radar and storm report data, creating an animation of the two!
On September 7, 2021, a strong line of thunderstorms passed through Southern Wisconsin and Northern Illinois, leaving a trail of hail and wind damage in its path.
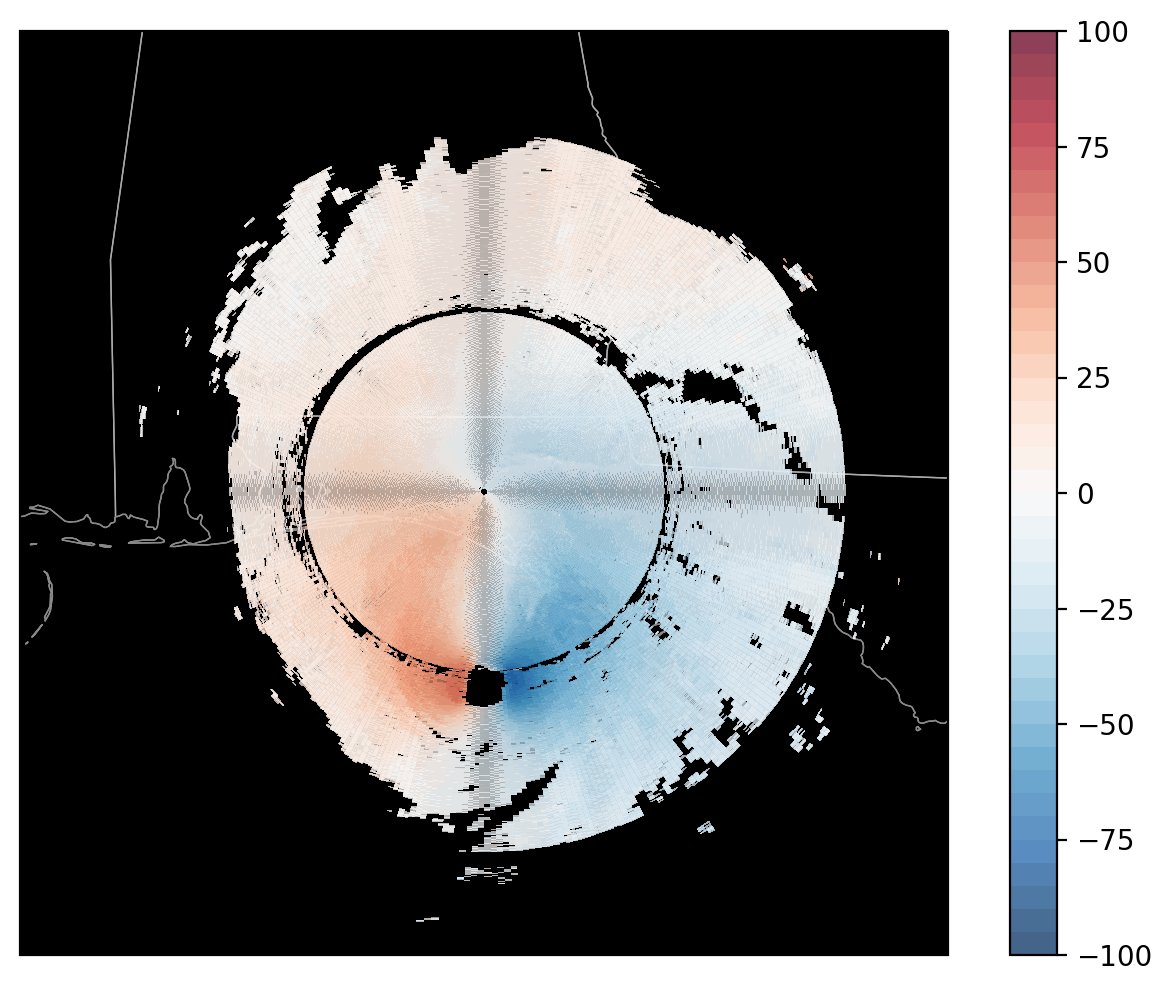
Fixing Weird Patterns When Plotting NEXRAD Level 3 Data
- 12 April 2022
The motivation here comes from a thread on Twitter, indicating an issue when plotting NEXRAD Level 3 radial velocity (NOU).
Here is the radar image, plotted by David (@dryglick):
Working with Vertically Pointing Radar Data Using PyART, Xarray, and hvPlot
- 21 March 2022
This notebook will walk through how to utilize existing packages in the Python ecosystem (PyART, Xarray, and hvPlot) to visualize data from a vertically pointing Ka-band radar.
By the end of this notebook, you will learn how to create the following visualization:
New Docs
- 11 March 2022
Hello All!
Welcome to our new documentation page! This is a new section within the docs meant for: