Note
Go to the end to download the full example code.
Airnow Data#
This example shows the different ways to pull air quality information from EPA’s AirNow API for a station near to SGP
<xarray.Dataset> Size: 776B
Dimensions:         (index: 8)
Coordinates:
  * index           (index) int64 64B 0 1 2 3 4 5 6 7
Data variables:
    DateIssue       (index) object 64B '2022-04-29' ... '2022-04-29'
    DateForecast    (index) object 64B '2022-05-01' ... '2022-05-04'
    ReportingArea   (index) object 64B 'Oklahoma City' ... 'Oklahoma City'
    StateCode       (index) object 64B 'OK' 'OK' 'OK' 'OK' 'OK' 'OK' 'OK' 'OK'
    Latitude        (index) float64 64B 35.51 35.51 35.51 ... 35.51 35.51 35.51
    Longitude       (index) float64 64B -97.47 -97.47 -97.47 ... -97.47 -97.47
    ParameterName   (index) object 64B 'O3' 'PM2.5' 'O3' ... 'O3' 'PM2.5'
    AQI             (index) int64 64B 50 40 30 20 50 30 30 20
    CategoryNumber  (index) int64 64B 1 1 1 1 1 1 1 1
    CategoryName    (index) object 64B 'Good' 'Good' 'Good' ... 'Good' 'Good'
    ActionDay       (index) bool 8B False False False ... False False False
    Discussion      (index) object 64B 'Southerly winds today will bring mois...
<xarray.Dataset> Size: 288B
Dimensions:         (index: 3)
Coordinates:
  * index           (index) int64 24B 0 1 2
Data variables:
    DateObserved    (index) object 24B '2022-05-01' '2022-05-01' '2022-05-01'
    HourObserved    (index) int64 24B 0 0 0
    LocalTimeZone   (index) object 24B 'CST' 'CST' 'CST'
    ReportingArea   (index) object 24B 'Oklahoma City' ... 'Oklahoma City'
    StateCode       (index) object 24B 'OK' 'OK' 'OK'
    Latitude        (index) float64 24B 35.51 35.51 35.51
    Longitude       (index) float64 24B -97.47 -97.47 -97.47
    ParameterName   (index) object 24B 'OZONE' 'PM2.5' 'PM10'
    AQI             (index) int64 24B 51 39 19
    CategoryNumber  (index) int64 24B 2 1 1
    CategoryName    (index) object 24B 'Moderate' 'Good' 'Good'
<xarray.Dataset> Size: 584B
Dimensions:            (time: 13)
Coordinates:
  * time               (time) datetime64[us] 104B 2022-05-01 ... 2022-05-01T1...
    sites              <U10 40B 'Ponca City'
Data variables:
    latitude           float64 8B 36.7
    longitude          float64 8B -97.08
    aqs_id             int64 8B 400710604
    PM2.5              (time) float64 104B 4.3 5.3 5.9 6.9 ... 7.7 7.4 7.6 7.8
    AQI                (time) float64 104B 24.0 29.0 33.0 ... 41.0 42.0 43.0
    category           (time) float64 104B 1.0 1.0 1.0 1.0 ... 1.0 1.0 1.0 1.0
    raw_concentration  (time) float64 104B 5.1 6.3 6.5 7.9 ... 7.1 7.1 7.8 8.1
/home/runner/work/ACT/ACT/act/plotting/plot.py:81: UserWarning: Could not discern datastreamname and dict or tuple were not provided. Using defaultname of act_datastream!
  warnings.warn(
import os
import matplotlib.pyplot as plt
import act
# You need an account and token from https://docs.airnowapi.org/ first
token = os.getenv('AIRNOW_API')
if token is not None and len(token) > 0:
# This first example will get the forcasted values for the date passed
# at stations within 100 miles of the Zipcode. Can also use latlon instead as
# results = act.discovery.get_airnow_forecast(token, '2022-05-01', distance=100,
# latlon=[41.958, -88.12])
# If the username and token are not set, use the existing sample file
results = act.discovery.get_airnow_forecast(token, '2022-05-01', zipcode=74630, distance=100)
# The results show a dataset with air quality information from Oklahoma City
# The data is not indexed by time and just a rudimentary xarray object from
# converted from a pandas DataFrame. Note that the AirNow API labels the data
# returned as AQI.
print(results)
# This call gives the daily average for Ozone, PM2.5 and PM10
results = act.discovery.get_airnow_obs(token, date='2022-05-01', zipcode=74630, distance=100)
print(results)
# This call will get all the station data for a time period within
# the bounding box provided. This will return the object with time
# as a coordinate and can be used with ACT Plotting to plot after
# squeezing the dimensions. It can be a 2D time series
lat_lon = '-98.172,35.879,-96.76,37.069'
results = act.discovery.get_airnow_bounded_obs(
token, '2022-05-01T00', '2022-05-01T12', lat_lon, 'OZONE,PM25', data_type='B'
)
# Reduce to 1D timeseries
results = results.squeeze(dim='sites', drop=False)
print(results)
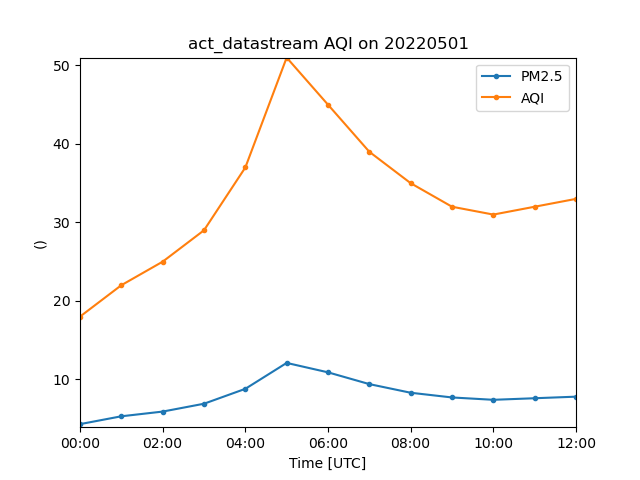
# Plot out data but note that Ozone was not return in the results
display = act.plotting.TimeSeriesDisplay(results)
display.plot('PM2.5', label='PM2.5')
display.plot('AQI', label='AQI')
plt.legend()
plt.show()
Total running time of the script: (0 minutes 1.828 seconds)