Note
Go to the end to download the full example code.
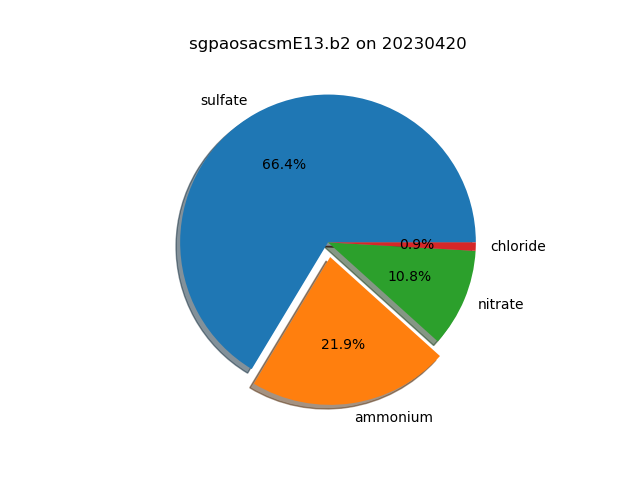
Calculate and View Aerosol Percentages#
Calculate the percentages of different aerosols in a Aerosol Chemical Speciation (AOS) monitor dataset and view the percentages in a pie chart.
Written: Zach Sherman
KeysView(Data variables:
    base_time                     datetime64[ns] 8B 2023-04-20
    time_offset                   (time) datetime64[ns] 408B 2023-04-20T00:01...
    time_bounds                   (time, bound) object 816B dask.array<chunksize=(51, 2), meta=np.ndarray>
    total_organics                (time) float32 204B dask.array<chunksize=(51,), meta=np.ndarray>
    qc_total_organics             (time) int32 204B dask.array<chunksize=(51,), meta=np.ndarray>
    sulfate                       (time) float32 204B dask.array<chunksize=(51,), meta=np.ndarray>
    qc_sulfate                    (time) int32 204B dask.array<chunksize=(51,), meta=np.ndarray>
    ammonium                      (time) float32 204B dask.array<chunksize=(51,), meta=np.ndarray>
    qc_ammonium                   (time) int32 204B dask.array<chunksize=(51,), meta=np.ndarray>
    nitrate                       (time) float32 204B dask.array<chunksize=(51,), meta=np.ndarray>
    qc_nitrate                    (time) int32 204B dask.array<chunksize=(51,), meta=np.ndarray>
    chloride                      (time) float32 204B dask.array<chunksize=(51,), meta=np.ndarray>
    qc_chloride                   (time) int32 204B dask.array<chunksize=(51,), meta=np.ndarray>
    airbeam_normalization_factor  (time) float32 204B dask.array<chunksize=(51,), meta=np.ndarray>
    inlet_pressure                (time) float32 204B dask.array<chunksize=(51,), meta=np.ndarray>
    lat                           float32 4B ...
    lon                           float32 4B ...
    alt                           float32 4B ...)
import matplotlib.pyplot as plt
from arm_test_data import DATASETS

import act
from act.io.arm import read_arm_netcdf

# Read an ARM AOS dataset
filename = DATASETS.fetch('sgpaosacsmE13.b2.20230420.000109.nc')
ds = read_arm_netcdf(filename)

# Let us print out the fields in the dataset and see what it contains.
print(ds.data_vars.keys())

# Knowing what fields the dataset contains, let's create a list of fields
# to use in the plot.

fields = ['sulfate', 'ammonium', 'nitrate', 'chloride']

# We also want to provide some keyword arguments to avoid invalid data such
# as negative values.
threshold = 0.0
fill_value = 0.0

# Create a DistributionDisplay object to compare fields
display = act.plotting.DistributionDisplay(ds)

# We can set one of the slices to explode and give it a nice shadow.
explode = (0, 0.1, 0, 0)
shadow = True

# Create a pie chart using the fields list. The percentages of the
# fields will be calculated using act.utils.calculate_percentages.
display.plot_pie_chart(
    fields,
    threshold=threshold,
    fill_value=fill_value,
    explode=explode,
    shadow=True,
)
plt.show()
Total running time of the script: (0 minutes 0.086 seconds)