Note
Go to the end to download the full example code.
Read and plot a PPI from raw mini-MPL data#
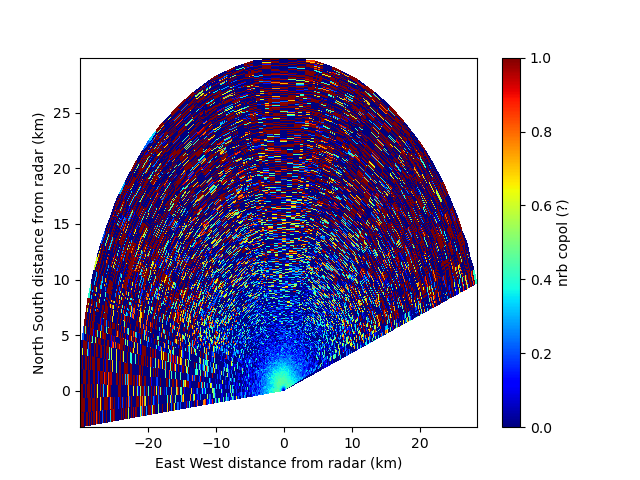
Example of how to read in raw data from the mini-MPL and plot out the PPI by converting it to PyART
Author: Adam Theisen
## You are using the Python ARM Radar Toolkit (Py-ART), an open source
## library for working with weather radar data. Py-ART is partly supported
## by the U.S. Department of Energy Office of Science as part of
## the Atmospheric Radiation Measurement (ARM) User Facility.
##
## If you use this software to prepare a publication, please cite:
##
##     JJ Helmus and SM Collis, JORS 2016, doi: 10.5334/jors.119

/home/runner/micromamba/envs/act-docs/lib/python3.14/site-packages/pyart/graph/max_cappi.py:20: DeprecationWarning: The LATITUDE_FORMATTER module-level attribute was deprecated in Cartopy 0.26. Use LatitudeFormatter instead.
  from cartopy.mpl.gridliner import LATITUDE_FORMATTER, LONGITUDE_FORMATTER
/home/runner/micromamba/envs/act-docs/lib/python3.14/site-packages/pyart/graph/max_cappi.py:20: DeprecationWarning: The LONGITUDE_FORMATTER module-level attribute was deprecated in Cartopy 0.26. Use LongitudeFormatter instead.
  from cartopy.mpl.gridliner import LATITUDE_FORMATTER, LONGITUDE_FORMATTER
from arm_test_data import DATASETS
from matplotlib import pyplot as plt

import act

try:
    import pyart

    PYART_AVAILABLE = True
except ImportError:
    PYART_AVAILABLE = False

# Read in sample mini-MPL data
filename_mpl = DATASETS.fetch('201509021500.bi')
ds = act.io.mpl.read_sigma_mplv5(filename_mpl)

# Create a PyART Radar Object
radar = act.utils.create_pyart_obj(
    ds, azimuth='azimuth_angle', elevation='elevation_angle', range_var='range'
)

# Creat Plot Display
if PYART_AVAILABLE:
    display = pyart.graph.RadarDisplay(radar)
    display.plot('nrb_copol', sweep=0, title_flag=False, vmin=0, vmax=1.0, cmap='jet')
    plt.show()
Total running time of the script: (0 minutes 1.074 seconds)