Note
Go to the end to download the full example code.
Transforming a whole Dataset at once#
act.transform.transform_dataset applies a transform to every variable in a
Dataset that has the target dimension, pairing each variable with its qc_
companion automatically and picking up the CF bounds variable for
bin_average. Per-variable overrides are useful when variables in one
Dataset require different transforms.
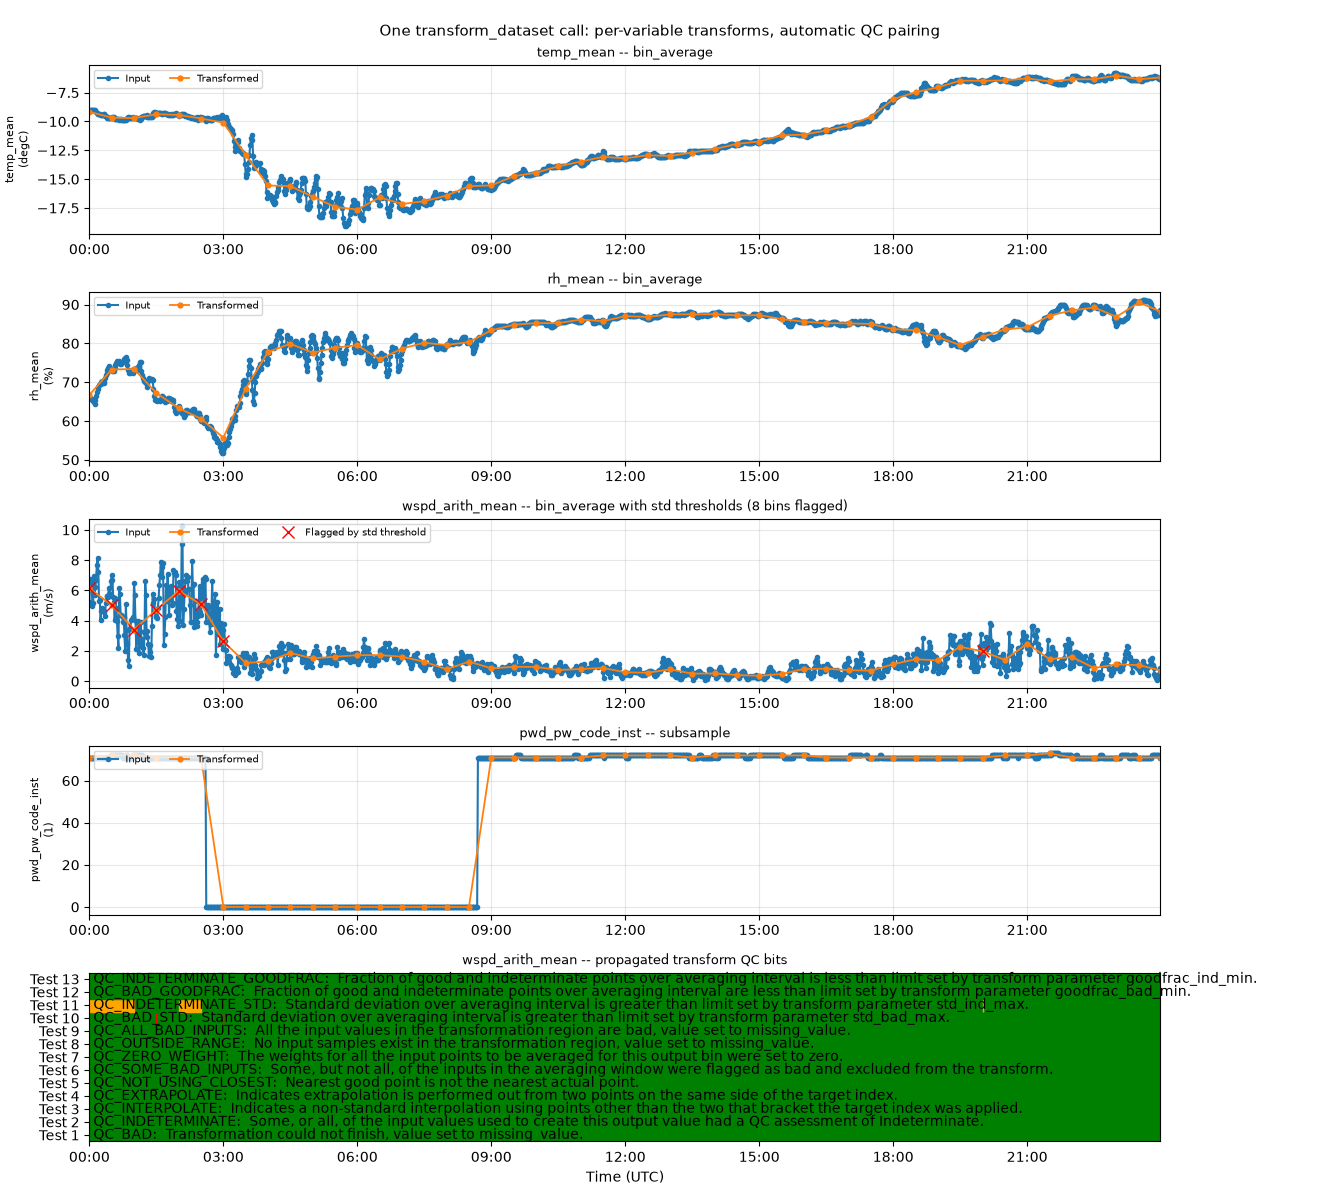
Input:  1440 times, 51 variables
Output: 49 times, 56 variables
Global attributes preserved: True

Output QC standard_name: quality_flag
Output QC flag_masks: [1, 2, 4, 8] ...
Wind speed points masked by ds.qcfilter: 8
import matplotlib.pyplot as plt
import numpy as np
from arm_test_data import DATASETS

import act

filename = DATASETS.fetch('gucmetM1.b1.20230301.000000.cdf')
ds = act.io.arm.read_arm_netcdf(filename, cleanup_qc=True)

target = act.transform.make_coord('2023-03-01', '2023-03-02', '30min', name='time')

# Transform the entire Dataset in one call.
#
#   * Every variable with a 'time' dimension is bin-averaged by default.
#   * Each variable's qc_<var> companion is found and honored automatically;
#     qc_mask=4 is the fail_max bit in this datastream.
#   * time_bounds is followed as CF bounds for bin_average, and is not itself
#     transformed as if it were measured data.
#   * pwd_pw_code_inst is a categorical code, so it is subsampled instead.
#   * wdir_vec_mean is circular; subsampling avoids averaging across 0°/360°.
#   * wspd_arith_mean gets a standard-deviation threshold, flagging bins whose
#     input was too variable for a single mean to represent.
new_ds = act.transform.transform_dataset(
    ds,
    target=target,
    dim='time',
    transform='bin_average',
    qc_mask=4,
    per_var_transform={'pwd_pw_code_inst': 'subsample', 'wdir_vec_mean': 'subsample'},
    per_var_kwargs={'wspd_arith_mean': {'std_ind_max': 0.8, 'std_bad_max': 1.5}},
)

print(f'Input:  {ds.sizes["time"]} times, {len(ds.data_vars)} variables')
print(f'Output: {new_ds.sizes["time"]} times, {len(new_ds.data_vars)} variables')
print(f'Global attributes preserved: {len(new_ds.attrs) > 0}')

# Every transformed variable arrives with a companion QC variable carrying CF
# flag attributes, so ds.qcfilter works on the result without translation.
qc_out = new_ds['qc_wspd_arith_mean']
print(f'\nOutput QC standard_name: {qc_out.attrs["standard_name"]}')
print(f'Output QC flag_masks: {qc_out.attrs["flag_masks"][:4]} ...')

masked = new_ds.qcfilter.get_masked_data('wspd_arith_mean', rm_assessments=['Bad', 'Indeterminate'])
print(f'Wind speed points masked by ds.qcfilter: {int(np.ma.getmaskarray(masked).sum())}')

# Plot a few of the transformed variables together with the QC-driven mask.
# The final subplot expands the output QC bitfield for the wind-speed result.
plot_vars = ['temp_mean', 'rh_mean', 'wspd_arith_mean', 'pwd_pw_code_inst']
display = act.plotting.TimeSeriesDisplay(
    {'Input': ds, 'Transformed': new_ds},
    figsize=(13.2, 12),
    subplot_shape=(len(plot_vars) + 1,),
)

for subplot_index, name in enumerate(plot_vars):
    ax = display.axes[subplot_index]
    display.plot(
        name,
        dsname='Input',
        subplot_index=(subplot_index,),
        label='Input',
    )
    display.plot(
        name,
        dsname='Transformed',
        subplot_index=(subplot_index,),
        label='Transformed',
        marker='o',
        ms=3.5,
        lw=1.3,
    )
    ax.set_ylabel(f'{name}\n({ds[name].attrs.get("units", "")})', fontsize=8)
    ax.grid(alpha=0.3)

    transform_used = 'subsample' if name == 'pwd_pw_code_inst' else 'bin_average'
    title = f'{name} -- {transform_used}'

    # For wind speed, mark the bins the standard-deviation threshold flagged.
    if name == 'wspd_arith_mean':
        flagged = np.ma.getmaskarray(masked)
        ax.plot(
            new_ds['time'].values[flagged],
            new_ds[name].values[flagged],
            'rx',
            ms=8,
            label='Flagged by std threshold',
        )
        title += f' with std thresholds ({flagged.sum()} bins flagged)'

    ax.set_title(title, fontsize=9)
    ax.legend(loc='upper left', fontsize=7, ncol=3)

# The block plot shows which output QC assessments were raised for the wind
# speed transform, including the threshold bits and any propagated input QC.
new_ds['wspd_arith_mean'].attrs['ancillary_variables'] = 'qc_wspd_arith_mean'
display.qc_flag_block_plot(
    'wspd_arith_mean',
    dsname='Transformed',
    subplot_index=(len(plot_vars),),
    ylabel='Output QC flags',
)
display.axes[-1].set_title('wspd_arith_mean -- propagated transform QC bits', fontsize=9)
display.axes[-1].set_xlabel('Time (UTC)')
display.fig.suptitle(
    'One transform_dataset call: per-variable transforms, automatic QC pairing',
    fontsize=11,
)
display.fig.tight_layout()
plt.show()

ds.close()
Total running time of the script: (0 minutes 0.988 seconds)