Note
Go to the end to download the full example code.
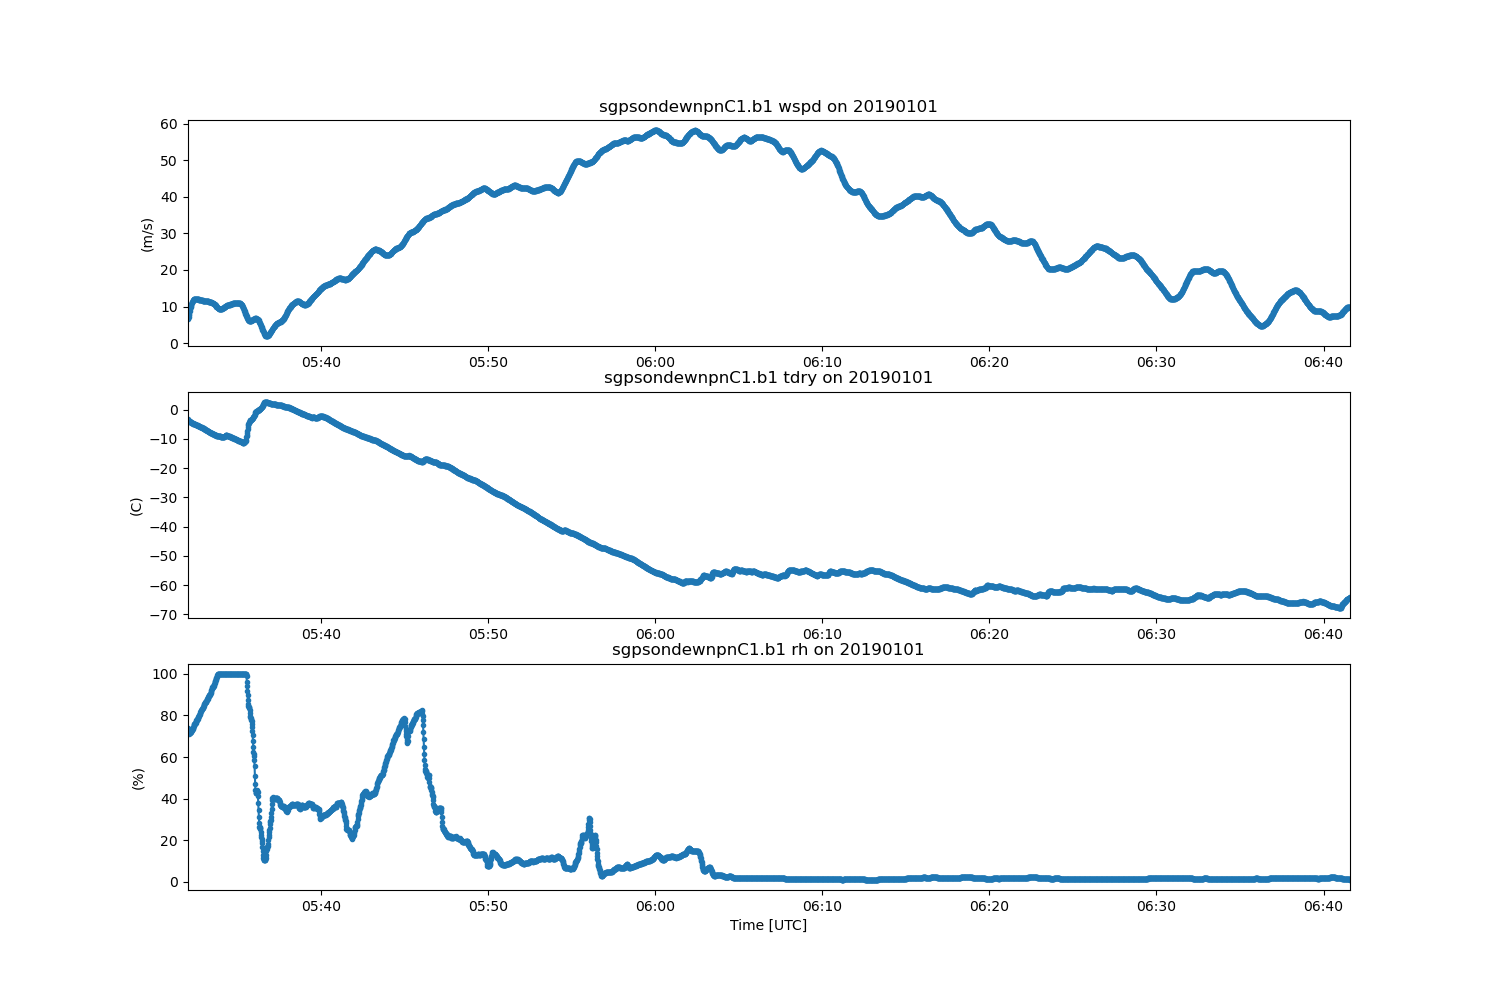
Plot a timeseries of sounding data#
This is a simple example for how to plot a timeseries of sounding data from the ARM SGP site.
Author: Robert Jackson
<xarray.Dataset> Size: 451kB
Dimensions:      (time: 4176)
Coordinates:
  * time         (time) datetime64[ns] 33kB 2019-01-01T05:32:00 ... 2019-01-0...
Data variables: (12/25)
    base_time    datetime64[ns] 8B 2019-01-01
    time_offset  (time) datetime64[ns] 33kB 2019-01-01T05:32:00 ... 2019-01-0...
    qc_time      (time) int32 17kB dask.array<chunksize=(4176,), meta=np.ndarray>
    pres         (time) float32 17kB dask.array<chunksize=(4176,), meta=np.ndarray>
    qc_pres      (time) int32 17kB dask.array<chunksize=(4176,), meta=np.ndarray>
    tdry         (time) float32 17kB dask.array<chunksize=(4176,), meta=np.ndarray>
    ...           ...
    wstat        (time) float32 17kB dask.array<chunksize=(4176,), meta=np.ndarray>
    asc          (time) float32 17kB dask.array<chunksize=(4176,), meta=np.ndarray>
    qc_asc       (time) int32 17kB dask.array<chunksize=(4176,), meta=np.ndarray>
    lat          (time) float32 17kB dask.array<chunksize=(4176,), meta=np.ndarray>
    lon          (time) float32 17kB dask.array<chunksize=(4176,), meta=np.ndarray>
    alt          (time) float32 17kB dask.array<chunksize=(4176,), meta=np.ndarray>
Attributes: (12/43)
    command_line:               sonde_ingest -s sgp -f C1
    process_version:            ingest-sonde-10.12-0.el6
    ingest_software:            ingest-sonde-10.12-0.el6
    dod_version:                sondewnpn-b1-2.1
    site_id:                    sgp
    facility_id:                C1: Lamont, Oklahoma
    ...                         ...
    history:                    created by user dsmgr on machine ruby at 2019...
    _file_dates:                ['20190101']
    _file_times:                ['053200']
    datastream:                 sgpsondewnpnC1.b1
    _datastream:                sgpsondewnpnC1.b1
    _arm_standards_flag:        1
from arm_test_data import DATASETS
from matplotlib import pyplot as plt

import act

filename_sonde = DATASETS.fetch('sgpsondewnpnC1.b1.20190101.053200.cdf')
sonde_ds = act.io.arm.read_arm_netcdf(filename_sonde)
print(sonde_ds)

# Plot data
display = act.plotting.TimeSeriesDisplay(sonde_ds)
display.add_subplots((3,), figsize=(15, 10))
display.plot('wspd', subplot_index=(0,))
display.plot('tdry', subplot_index=(1,))
display.plot('rh', subplot_index=(2,))
plt.show()
Total running time of the script: (0 minutes 0.263 seconds)