Note
Go to the end to download the full example code.
Choose a Colormap for your Plot#
This is an example of what colormaps are available in Py-ART, and how to add them to your own plots.
print(__doc__)

# Author: Max Grover (mgrover@anl.gov)
# License: BSD 3 clause

import matplotlib.pyplot as plt
import numpy as np

import pyart
from pyart.testing import get_test_data
Plot the available colormaps
Let’s see which colormaps are available in Py-ART from the colormap package cmweather! We use a helper function from matplotlib to plot this.
# Setup some helper functions and ranges to visualize our colormaps, from matplotlib
gradient = np.linspace(0, 1, 256)
gradient = np.vstack((gradient, gradient))


def plot_color_gradients(cmap_category, cmap_list):
    # Create figure and adjust figure height to number of colormaps
    nrows = len(cmap_list)
    figh = 0.35 + 0.15 + (nrows + (nrows - 1) * 0.1) * 0.22
    fig, axs = plt.subplots(nrows=nrows, figsize=(6.4, figh))
    fig.subplots_adjust(top=1 - 0.35 / figh, bottom=0.15 / figh, left=0.4, right=0.99)

    axs[0].set_title(cmap_category + " Colormaps", fontsize=14)

    for ax, cmap_name in zip(axs, cmap_list):
        ax.imshow(gradient, aspect="auto", cmap=f"{cmap_name}")
        ax.text(
            -0.01,
            0.5,
            f"{cmap_name}",
            va="center",
            ha="right",
            fontsize=10,
            transform=ax.transAxes,
        )

    # Turn off *all* ticks & spines, not just the ones with colormaps.
    for ax in axs:
        ax.set_axis_off()
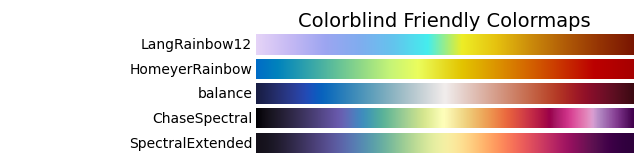
Colorblind Friendly Colormaps
We recommend starting with these colorblind friendly colormaps. These colormaps are the most inclusive, and should be used where possible.
plot_color_gradients(
    "Colorblind Friendly",
    ["LangRainbow12", "HomeyerRainbow", "balance", "ChaseSpectral", "SpectralExtended"],
)
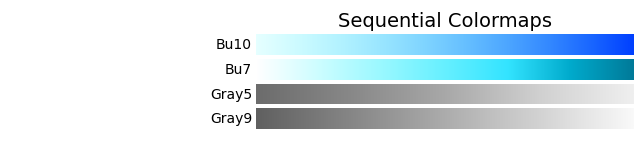
Perceptually Uniform Colormaps
More generally, perceptually uniform colormaps are colormaps where the lightness value increases monotonically through the colormaps.
plot_color_gradients(
    "Sequential",
    [
        "Bu10",
        "Bu7",
        "Gray5",
        "Gray9",
    ],
)
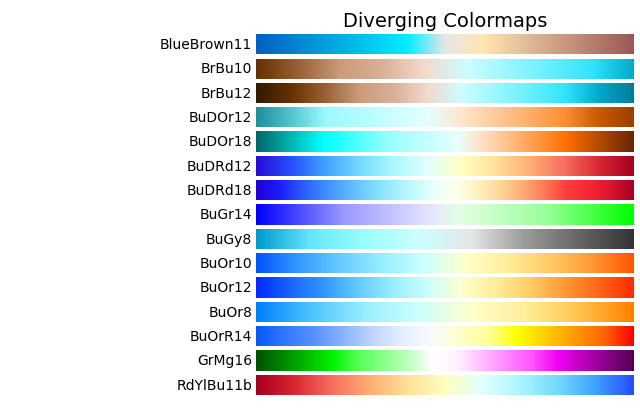
Diverging Colormaps
Diverging colormaps are helpful when showing positive and negative values. This is when the 0 value is meaningful (ex. velocity)
plot_color_gradients(
    "Diverging",
    [
        "BlueBrown11",
        "BrBu10",
        "BrBu12",
        "BuDOr12",
        "BuDOr18",
        "BuDRd12",
        "BuDRd18",
        "BuGr14",
        "BuGy8",
        "BuOr10",
        "BuOr12",
        "BuOr8",
        "BuOrR14",
        "GrMg16",
        "RdYlBu11b",
    ],
)
Field-Specific Colormaps
There are some colormaps that useful for specific fields, such as “BlueBrown10” for terrain, or NWSRef for the National Weather Service reflectivity field
plot_color_gradients(
    "Field-specific ",
    [
        "BlueBrown10",
        "Carbone11",
        "Carbone17",
        "Carbone42",
        "Cat12",
        "EWilson17",
        "NWSRef",
        "NWSVel",
        "NWS_SPW",
        "PD17",
        "RRate11",
        "RefDiff",
        "SCook18",
        "StepSeq25",
        "SymGray12",
        "Theodore16",
        "Wild25",
    ],
)

Plot Using a Colormap from Matplotlib
Now, we can apply one of these colorbars to plot and compare to a colormap from matplotlib, starting with the matplotlib example.
# Read in a sample cfradial file
radar_file = get_test_data("swx_20120520_0641.nc")
radar = pyart.io.read(radar_file)

# Setup a display to plot the data
display = pyart.graph.RadarDisplay(radar)

# Start by plotting a regular matplotlib colormap (Spectral_r)
display.plot("reflectivity_horizontal", vmin=-32, vmax=64.0, cmap="Spectral_r")
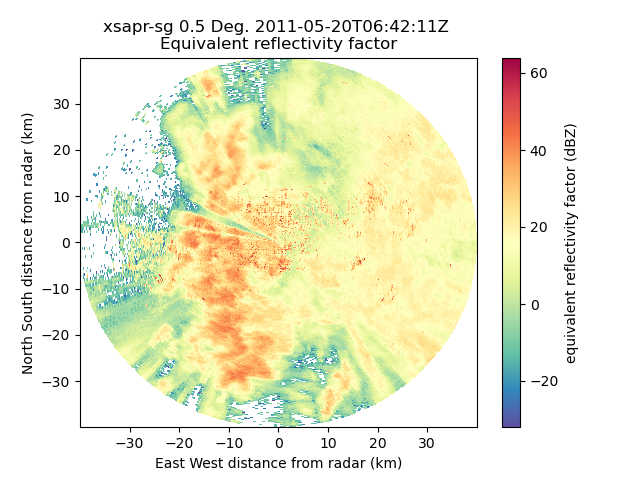
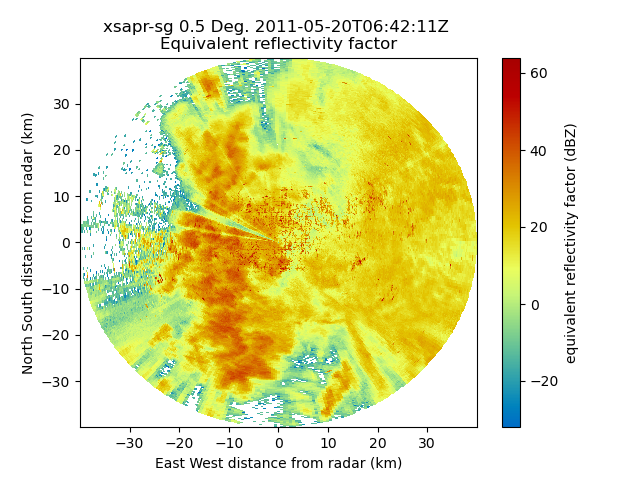
Plot Using a Colormap from Py-ART
Let’s use one of our cmweather’s colorbars now! Setup a display to plot the data
display = pyart.graph.RadarDisplay(radar)

# Now let's plot with a CVD-friendly colormap (HomeyerRainbow)
display.plot("reflectivity_horizontal", vmin=-32, vmax=64.0, cmap="HomeyerRainbow")
Total running time of the script: (0 minutes 2.044 seconds)