Note
Go to the end to download the full example code.
Modify a Colorbar for your Plot#
This is an example of how to modify a colobar within a Py-ART display object.
print(__doc__)

# Author: Joe O'Brien (obrienj@anl.gov)
# License: BSD 3 clause

import cartopy.crs as ccrs
import matplotlib.pyplot as plt

import pyart
from pyart.testing import get_test_data
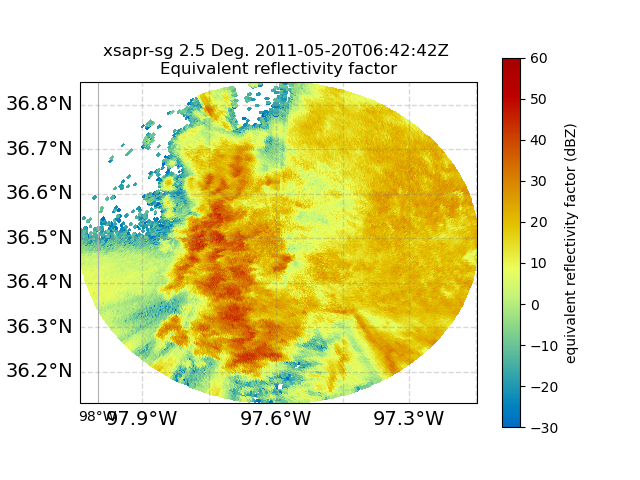
Initial PPI Map Display#
Let’s plot a PPI Map Display and take a look at the colorbar
Notice: the colorbar is not perfect and slightly overlaps the PPI display
# Define figure
fig = plt.figure()

# Create a subplot with correct cartopy projection
axs = plt.subplot(111, projection=ccrs.PlateCarree())

# Define and Read in the test data
radar_file = get_test_data("swx_20120520_0641.nc")
radar = pyart.io.read(radar_file)

# Create the Radar Map Display (defines x,y as lat/lons)
display = pyart.graph.RadarMapDisplay(radar)

# Display the horizontal equivalent reflectivity factor
# Note: embellish = False will remove initial lat/lon coords
display.plot_ppi_map(
    "reflectivity_horizontal",
    2,
    ax=axs,
    vmin=-30,
    vmax=60,
    embellish=False,
    norm=None,
    cmap="HomeyerRainbow",
)

# Add gridlines
gl = axs.gridlines(
    crs=ccrs.PlateCarree(),
    draw_labels=True,
    linewidth=1,
    color="gray",
    alpha=0.3,
    linestyle="--",
)

plt.gca().xaxis.set_major_locator(plt.NullLocator())

# Make sure labels are only plotted on the left and bottom
gl.top_labels = False
gl.right_labels = False

gl.xlabel_style = {"size": 14}
gl.ylabel_style = {"size": 14}

# delete the display object
del display
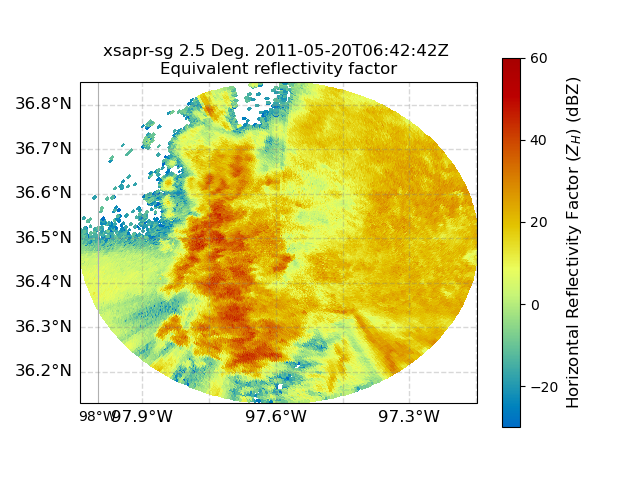
Colorbar Position / Title Manipulation#
Now, let’s update the colorbar position to match the display
# Define figure
fig = plt.figure()

# Create a subplot with correct cartopy projection
axsB = plt.subplot(111, projection=ccrs.PlateCarree())

# Create the Radar Map Display (defines x,y as lat/lons)
display = pyart.graph.RadarMapDisplay(radar)

# Create the display again
ppi_map = display.plot_ppi_map(
    "reflectivity_horizontal",
    2,
    ax=axsB,
    vmin=-30,
    vmax=60,
    embellish=False,
    norm=None,
    cmap="HomeyerRainbow",
)

# Add gridlines
gl = axsB.gridlines(
    crs=ccrs.PlateCarree(),
    draw_labels=True,
    linewidth=1,
    color="gray",
    alpha=0.3,
    linestyle="--",
)

plt.gca().xaxis.set_major_locator(plt.NullLocator())

# Make sure labels are only plotted on the left and bottom
gl.top_labels = False
gl.right_labels = False

# Define the size of the grid labels
gl.xlabel_style = {"size": 12}
gl.ylabel_style = {"size": 12}

# Define the colorbar from the RadarMapDisplay object
cbar = display.cbs[0]
# Modify the colorbar label and size
cbar.set_label(label="Horizontal Reflectivity Factor ($Z_{H}$) (dBZ)", fontsize=12)
# Modify the number of colorbar ticks
cbar.set_ticks([-20, 0, 20, 40, 60])
Total running time of the script: (0 minutes 3.317 seconds)