Note
Go to the end to download the full example code.
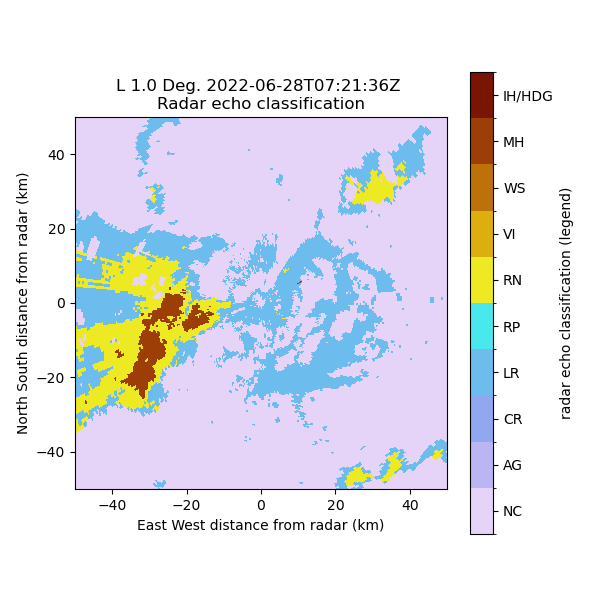
Calculate and Plot hydrometeor classification#
Calculates a hydrometeor classification and displays the results
# Author: Daniel Wolfensberger (daniel.wolfensberger@meteoswiss.ch)
# License: BSD 3 clause

import matplotlib as mpl
import matplotlib.pyplot as plt
import numpy as np
from open_radar_data import DATASETS

import pyart

# Read in a sample file
filename = DATASETS.fetch("MLL2217907250U.003.nc")
radar = pyart.io.read_cfradial(filename)

# Read temperature preinterpolated from NWP model
filename = DATASETS.fetch("20220628072500_savevol_COSMO_LOOKUP_TEMP.nc")
nwp_temp = pyart.io.read_cfradial(filename)

# Add temperature to radar object as new field
radar.add_field("temperature", nwp_temp.fields["temperature"])

# Compute attenuation
out = pyart.correct.calculate_attenuation_zphi(
    radar,
    phidp_field="uncorrected_differential_phase",
    temp_field="temperature",
    temp_ref="temperature",
)
spec_at, pia, cor_z, spec_diff_at, pida, cor_zdr = out
radar.add_field("corrected_reflectivity", cor_z)
radar.add_field("corrected_differential_reflectivity", cor_zdr)
radar.add_field("specific_attenuation", spec_at)

# Compute KDP
kdp, _, _ = pyart.retrieve.kdp_maesaka(
    radar, psidp_field="uncorrected_differential_phase"
)
radar.add_field("specific_differential_phase", kdp)

# Compute hydrometeor classification
hydro = pyart.retrieve.hydroclass_semisupervised(
    radar,
    refl_field="corrected_reflectivity",
    zdr_field="corrected_differential_reflectivity",
    kdp_field="specific_differential_phase",
    rhv_field="uncorrected_cross_correlation_ratio",
    temp_field="temperature",
)["hydro"]

radar.add_field("radar_echo_classification", hydro)

# Display hydrometeor classification with categorical colormap
fig, ax = plt.subplots(1, 1, figsize=(6, 6))
display = pyart.graph.RadarDisplay(radar)

labels = ["NC", "AG", "CR", "LR", "RP", "RN", "VI", "WS", "MH", "IH/HDG"]
ticks = np.arange(len(labels))
boundaries = np.arange(-0.5, len(labels))
norm = mpl.colors.BoundaryNorm(boundaries, 256)

cax = display.plot_ppi(
    "radar_echo_classification", 0, ax=ax, norm=norm, ticks=ticks, ticklabs=labels
)

ax.set_xlim([-50, 50])
ax.set_ylim([-50, 50])
ax.set_aspect("equal", "box")

# For info
# NC = not classified
# AG = aggregates
# CR = ice crystals
# LR = light rain
# RP = rimed particles
# RN = rain
# VI = vertically oriented ice
# WS = wet snow
# MH = melting hail
# IH/HDG = dry hail / high density graupel
Total running time of the script: (0 minutes 2.800 seconds)