Note
Go to the end to download the full example code.
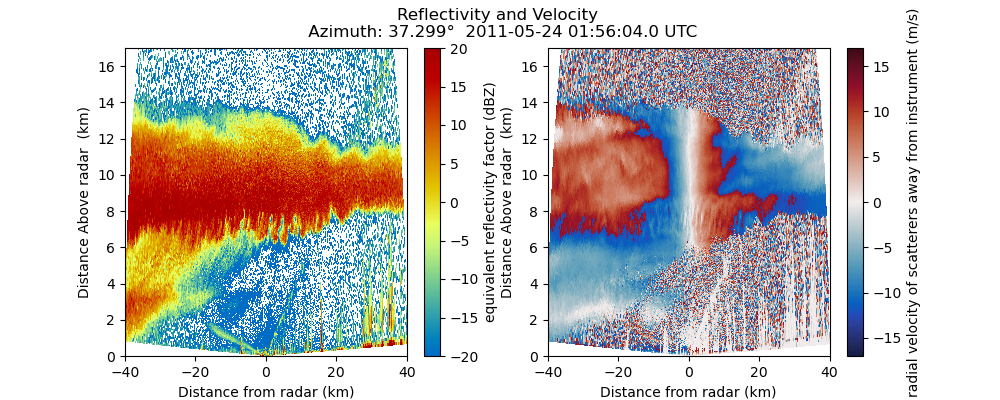
Create a two panel RHI plot#
An example which creates a two panel RHI plot of a cfradial file. The fields included in the two panels are reflectivity and doppler velocity.
print(__doc__)

# Author: Max Grover (mgrover@anl.gov)
# License: BSD 3 clause

import matplotlib.pyplot as plt
import numpy as np

import pyart
from pyart.testing import get_test_data

# Read the data and create the display object
filename = get_test_data("sgpxsaprrhicmacI5.c0.20110524.015604_NC4.nc")
radar = pyart.io.read_cfradial(filename)
display = pyart.graph.RadarDisplay(radar)

# Fields to plot and ranges
fields_to_plot = ["reflectivity_horizontal", "mean_doppler_velocity"]
ranges = [(-20, 20), (-17.0, 17.0)]
cmaps = ["HomeyerRainbow", "balance"]

# Plot the data
nplots = len(fields_to_plot)
plt.figure(figsize=[5 * nplots, 4])

# Plot each field
for plot_num in range(nplots):
    field = fields_to_plot[plot_num]
    vmin, vmax = ranges[plot_num]
    cmap = cmaps[plot_num]

    plt.subplot(1, nplots, plot_num + 1)
    display.plot(field, 0, vmin=vmin, vmax=vmax, title_flag=False, cmap=cmap)
    display.set_limits(ylim=[0, 17])

# Grab the fixed angle and time from the first sweep
fixed_angle = radar.fixed_angle["data"][0]
time = radar.time["units"][13:]

# Add the metadata to the title
plt.suptitle(
    f"Reflectivity and Velocity \n Azimuth: {np.around(fixed_angle, 3)}\u00b0 {time} UTC"
)
plt.show()
Total running time of the script: (0 minutes 0.963 seconds)