Note
Go to the end to download the full example code.
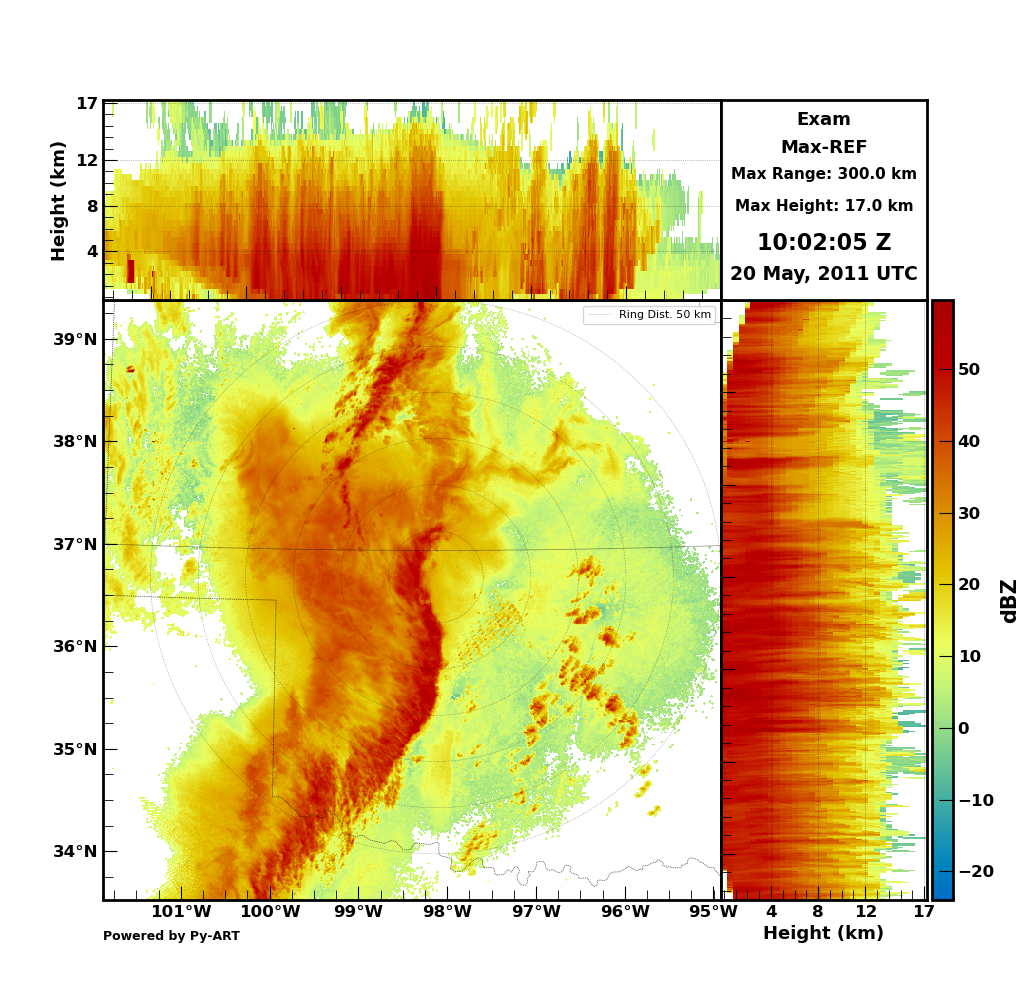
Plot Max-CAPPI#
This is an example of how to plot a Max-CAPPI within a Py-ART grid display object.
print(__doc__)

# Author: Hamid Ali Syed (syed44@purdue.edu)
# License: BSD 3 clause

import matplotlib.pyplot as plt
import numpy as np

import pyart
from pyart.testing import get_test_data
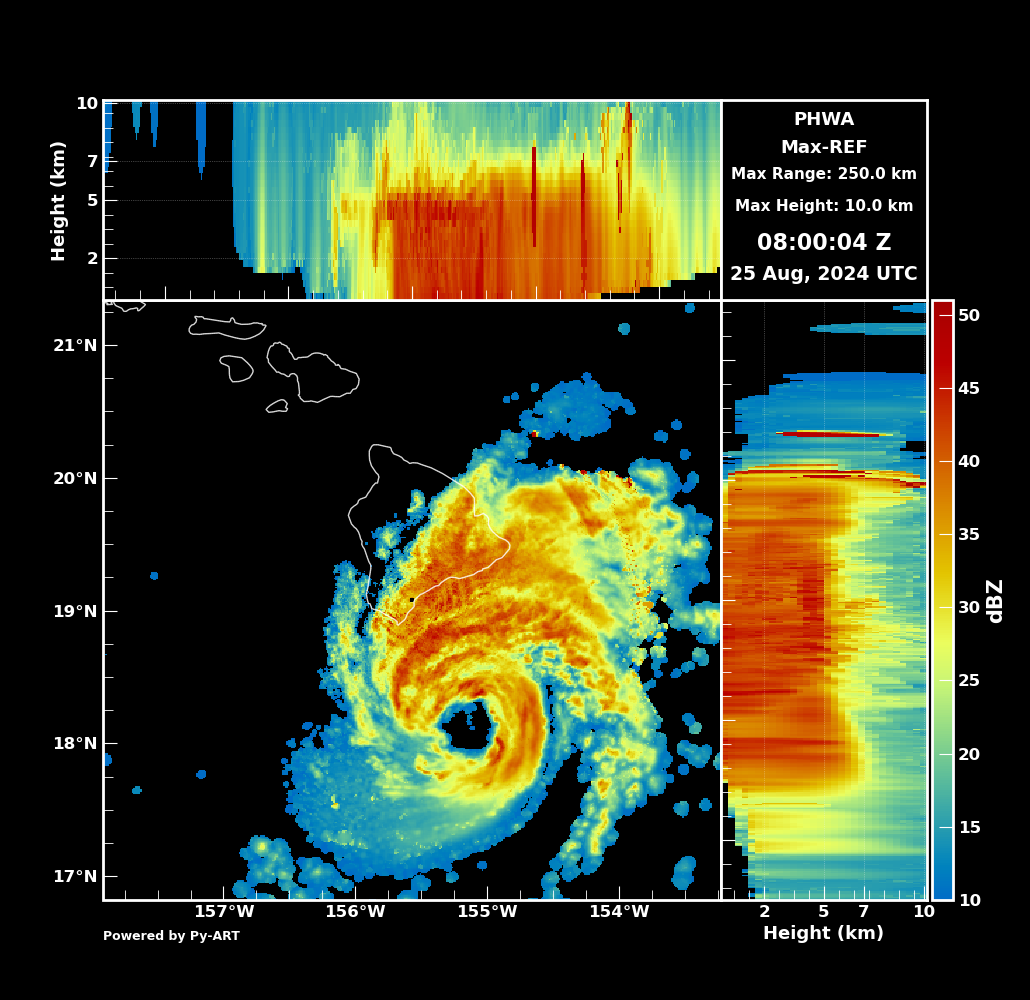
MAX-CAPPI Display#
Second Example#
Let’s read in a Nexrad data and create a grid.
import logging
from datetime import datetime

import fsspec


def download_nexrad(timezone, date, site, local_date=False):
    """Download NEXRAD radar data from an S3 bucket."""
    try:
        if local_date:
            # Make timezone-aware with UTC
            utc_date = date.replace(tzinfo=datetime.timezone.utc)
        else:
            utc_date = date
        logging.info(f"Time: {utc_date}")

        fs = fsspec.filesystem("s3", anon=True)
        nexrad_path = utc_date.strftime(
            f"s3://unidata-nexrad-level2/%Y/%m/%d/{site}/{site}%Y%m%d_%H*"
        )
        files = sorted(fs.glob(nexrad_path))

        return [file for file in files if not file.endswith("_MDM")]
    except Exception as e:
        logging.error("Error in processing: %s", e)
        return []


# Load NEXRAD data from S3 Bucket
site = "PHWA"
timezone = "UTC"
date = datetime(2024, 8, 25, 8, 29)

# Correctly passing the site and timezone
file = download_nexrad(timezone, date, site, local_date=False)[0]


# Read the data using nexrad_archive reader
radar = pyart.io.read_nexrad_archive("s3://" + file)

# Create a 3D grid
# Mask out last 10 gates of each ray, this removes the "ring" around the radar.
radar.fields["reflectivity"]["data"][:, -10:] = np.ma.masked

# Exclude masked gates from the gridding
gatefilter = pyart.filters.GateFilter(radar)
gatefilter.exclude_transition()
gatefilter.exclude_masked("reflectivity")
gatefilter.exclude_outside("reflectivity", 10, 80)

# Perform Cartesian mapping, limit to the reflectivity field.
max_range = np.ceil(radar.range["data"].max())
if max_range / 1e3 > 250:
    max_range = 250 * 1e3

grid = pyart.map.grid_from_radars(
    (radar,),
    gatefilters=(gatefilter,),
    grid_shape=(30, 441, 441),
    grid_limits=((0, 10000), (-max_range, max_range), (-max_range, max_range)),
    fields=["reflectivity"],
)

# Create a grid display
gdisplay = pyart.graph.GridMapDisplay(grid)
with plt.style.context("dark_background"):
    gdisplay.plot_maxcappi(field="reflectivity", cmap="HomeyerRainbow", add_slogan=True)
WARNING:matplotlib.font_manager:findfont: Font family 'Courier New' not found.
WARNING:matplotlib.font_manager:findfont: Font family 'Courier New' not found.
WARNING:matplotlib.font_manager:findfont: Font family 'Courier New' not found.
Total running time of the script: (0 minutes 13.491 seconds)