Note
Go to the end to download the full example code.
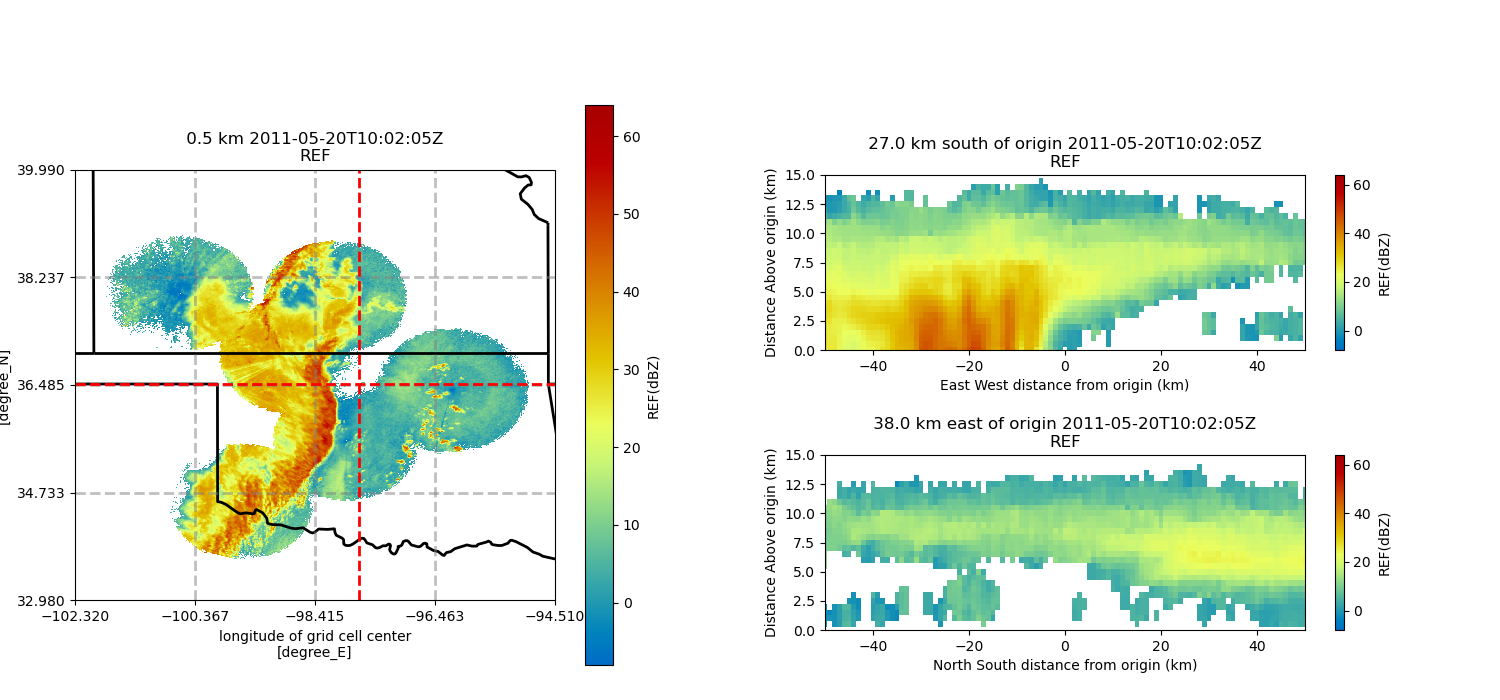
Create a 3 panel plot using GridMapDisplay#
An example that creates a 3 panel plot of a PPI, latitude slice, and longitude slice using xarray and a cartopy background.
print(__doc__)

# Author: Jason Hemedinger
# License: BSD 3 clause

import cartopy.crs as ccrs
import matplotlib.pyplot as plt

import pyart
from pyart.testing import get_test_data

# Read in the gridded file, create GridMapDisplay object
filename = get_test_data("20110520100000_nexrad_grid.nc")
radar = pyart.io.read_grid(filename)
display = pyart.graph.GridMapDisplay(radar)

# Setting projection, figure size, and panel sizes.
projection = ccrs.PlateCarree()

fig = plt.figure(figsize=[15, 7])

map_panel_axes = [0.05, 0.05, 0.4, 0.80]
x_cut_panel_axes = [0.55, 0.10, 0.4, 0.25]
y_cut_panel_axes = [0.55, 0.50, 0.4, 0.25]

# Set parameters.
level = 1
vmin = -8
vmax = 64
lat = 36.5
lon = -97.7

# Panel 1: PPI plot of the second tilt.
ax1 = fig.add_axes(map_panel_axes, projection=projection)
display.plot_grid(
    "REF",
    1,
    vmin=vmin,
    vmax=vmax,
    ax=ax1,
    projection=projection,
    cmap="HomeyerRainbow",
)
display.plot_crosshairs(lon=lon, lat=lat)

# Panel 2: longitude slice
ax2 = fig.add_axes(x_cut_panel_axes)
display.plot_longitude_slice(
    "REF", lon=lon, lat=lat, ax=ax2, vmin=vmin, vmax=vmax, cmap="HomeyerRainbow"
)

ax2.set_ylim([0, 15])
ax2.set_xlim([-50, 50])

# Panel 3: latitude slice
ax3 = fig.add_axes(y_cut_panel_axes)
display.plot_latitude_slice(
    "REF", lon=lon, lat=lat, ax=ax3, vmin=vmin, vmax=vmax, cmap="HomeyerRainbow"
)
ax3.set_ylim([0, 15])
ax3.set_xlim([-50, 50])

plt.show()
Total running time of the script: (14 minutes 0.629 seconds)