Note
Go to the end to download the full example code.
ZDR Bias Calculation#
This example shows how to calculate the ZDR bias from VPT/Birdbath scans. The technique here uses a vertically pointing scan in regions of light rain. In these regions, raindrops should be approximately spherical and therefore their ZDR near zero. Therefore, we want the average ZDR in these regions. This code applies reflectivity and cross correlation ratio-based threshold to the ZDR bias calculation to ensure that we are taking the average ZDR in light rain.
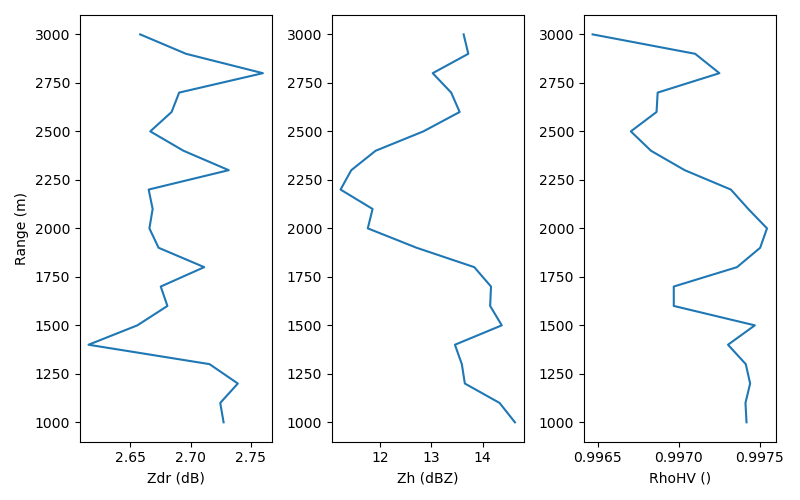
Zdr Bias: 2.69
import matplotlib.pyplot as plt
import xradar as xd
from open_radar_data import DATASETS

import pyart

# Read in example data
filename = DATASETS.fetch("sgpxsaprcfrvptI4.a1.20200205.100827.nc")

# Read in the data
tree = xd.io.open_cfradial1_datatree(filename)
radar = tree.pyart.to_radar()

# Set up a typical filter for ZDR bias calculation in birdbath scan
# Light rain and RhoHV near 1 ensures that raindrops are close to spherical
# Therefore ZDR should be zero in these regions
gatefilter = pyart.filters.GateFilter(radar)
gatefilter.exclude_below("cross_correlation_ratio_hv", 0.995)
gatefilter.exclude_above("cross_correlation_ratio_hv", 1)
gatefilter.exclude_below("reflectivity", 10)
gatefilter.exclude_above("reflectivity", 30)

results = pyart.correct.calc_zdr_offset(
    radar,
    zdr_var="differential_reflectivity",
    gatefilter=gatefilter,
    height_range=(1000, 3000),
)

print("Zdr Bias: " + "{:.2f}".format(results["bias"]))

fig, ax = plt.subplots(1, 3, figsize=(8, 5))
ax[0].plot(results["profile_zdr"], results["range"])
ax[0].set_ylabel("Range (m)")
ax[0].set_xlabel("Zdr (dB)")
ax[1].plot(results["profile_reflectivity"], results["range"])
ax[1].set_xlabel("Zh (dBZ)")
ax[2].plot(results["profile_cross_correlation_ratio_hv"], results["range"])
ax[2].set_xlabel("RhoHV ()")
fig.tight_layout()
plt.show()
Total running time of the script: (2 minutes 59.885 seconds)