Note
Go to the end to download the full example code.
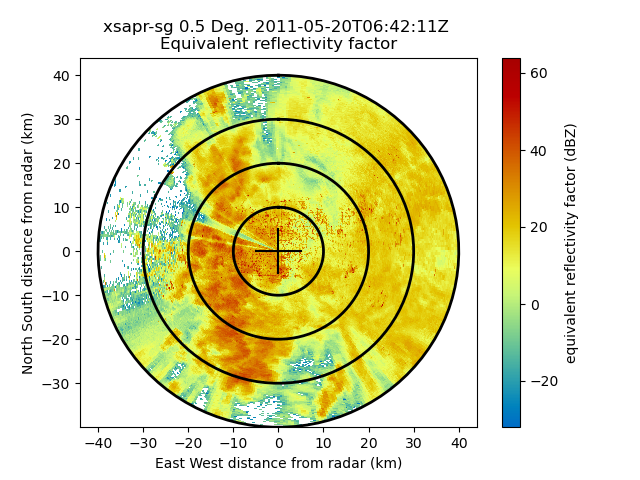
Create a PPI plot from a Cfradial file#
An example which creates a PPI plot of a Cfradial file.
print(__doc__)

# Author: Max Grover (mgrover@anl.gov)
# License: BSD 3 clause

import matplotlib.pyplot as plt

import pyart
from pyart.testing import get_test_data

# Locate the test data and read in using main read method
filename = get_test_data("swx_20120520_0641.nc")
radar = pyart.io.read(filename)

# Setup the display, which automatically detects this is a ppi scan
display = pyart.graph.RadarDisplay(radar)
fig = plt.figure()
ax = fig.add_subplot(111)
display.plot("reflectivity_horizontal", 0, vmin=-32, vmax=64.0)
display.plot_range_rings([10, 20, 30, 40])
display.plot_cross_hair(5.0)
plt.show()
Total running time of the script: (0 minutes 1.502 seconds)