Note
Go to the end to download the full example code.
Map a single PPI sweep to a Cartesian grid using 2D weighting#
Map the reflectivity field of a single PPI sweep from Antenna (polar) coordinates to a Cartesian grid, while using a 2D weighting. This solution is valid only for this case (single PPI sweep), yet it is a useful one (an arguably global solution since it overlooks the z-dimension grid limits). The exclusion of the z-dimension from the RoI and weighting calculations results in minor errors, especially considering the high co-variance of neighboring radar volumes and the typically small Cartesian grid separation. Errors are effectively negligible at low elevation angles common to PPI sweeps.
Total sweeps = 4
===
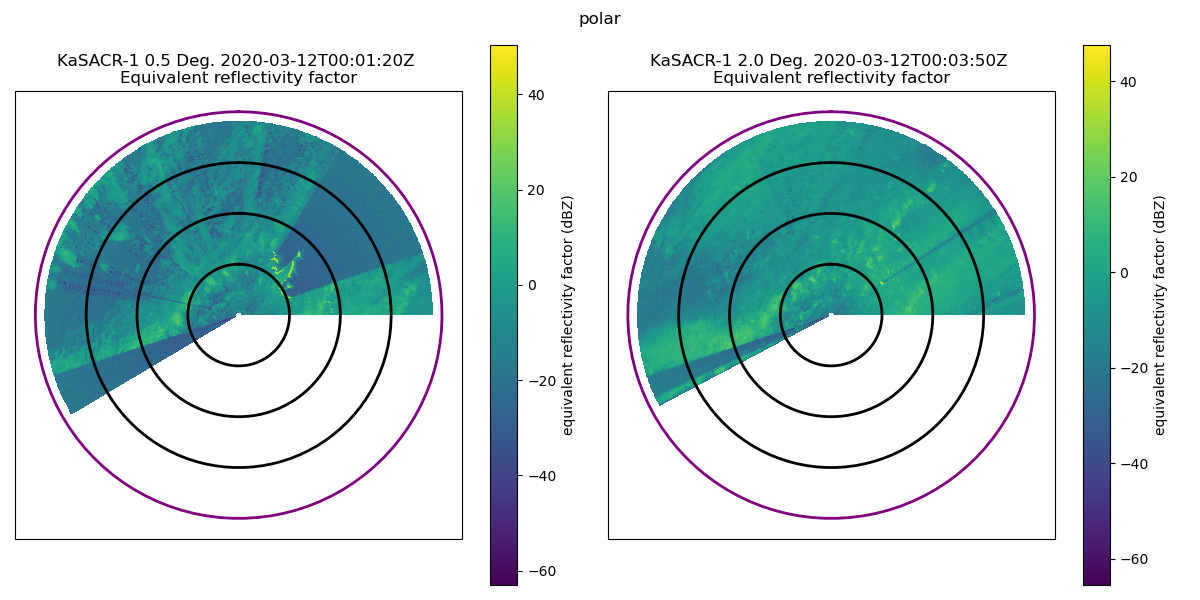
now displaying Ze data for 2nd and 4th sweeps in polar coordinates
(both approaching the 40 km range denoted by the purple ring)
===
===
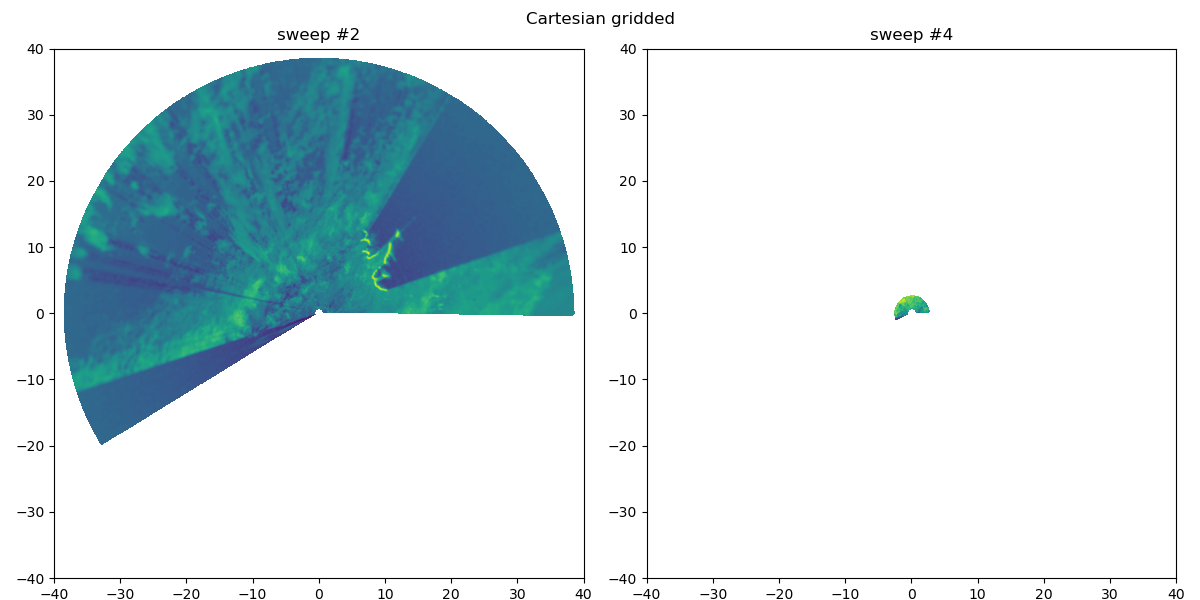
now displaying gridded Ze data for 2nd and 4th (final) sweeps; note the truncated max range in the case of the 4th sweep
===
===
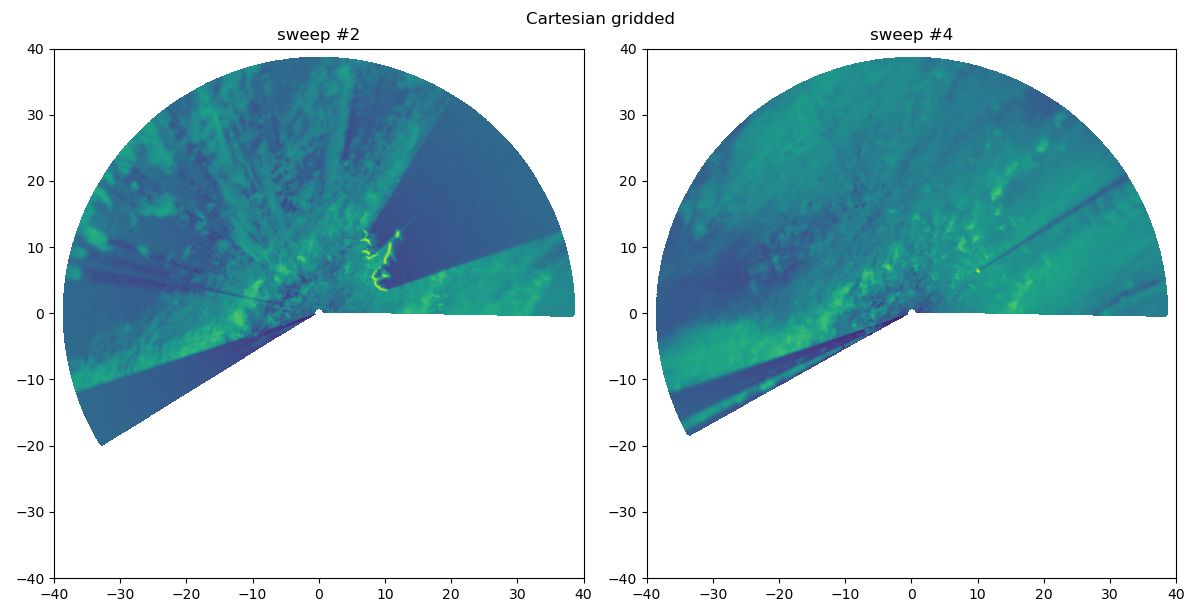
Using 2D weighting by setting h_factor and dist_factor z component to 0.0, the max range looks OK now
===
print(__doc__)

# =====================
# Author: Israel Silber
# =====================

import cartopy.crs as ccrs
import matplotlib.pyplot as plt
from open_radar_data import DATASETS

import pyart

# file, and fields
# =======================
file_name = DATASETS.fetch("example_plot_ppi_single_sweep.nc")
processed_field = "reflectivity_at_cor"

# load file
# =======================
radar_obj = pyart.io.read(file_name)
print(f"Total sweeps = {radar_obj.nsweeps}")

# Plot polar coordinate (raw) data
# =======================
print(
    "===\n\nnow displaying Ze data for 2nd and 4th sweeps in polar coordinates\n"
    "(both approaching the 40 km range denoted by the purple ring)\n\n==="
)
fig = plt.figure(figsize=(12, 6), tight_layout=True)
fig.suptitle("polar")
for sweep, ax_ind in zip([1, 3], range(2)):
    ax = fig.add_subplot(1, 2, ax_ind + 1, projection=ccrs.Mercator())
    sweep_obj = radar_obj.extract_sweeps((sweep,))
    display = pyart.graph.RadarDisplay(sweep_obj)
    display.plot(
        processed_field,
        sweep=0,
        ax=ax,
    )
    display.plot_range_rings([10, 20, 30])
    display.plot_range_rings([40], col="purple")
plt.show()

print(
    "===\n\nnow displaying gridded Ze data for 2nd and 4th (final) sweeps; note the "
    "truncated max range in the case of the 4th sweep\n\n==="
)
fig2 = plt.figure(figsize=(12, 6), tight_layout=True)
fig2.suptitle("Cartesian gridded")
for sweep, ax_ind in zip([1, 3], range(2)):
    sweep_obj = radar_obj.extract_sweeps((sweep,))
    grid = pyart.map.grid_from_radars(
        (sweep_obj,),
        grid_shape=(1, 1601, 1601),
        grid_limits=((0, 10000.0), [-40000, 40000], [-40000, 40000]),
        fields=[processed_field],
    )
    ax = fig2.add_subplot(1, 2, ax_ind + 1)
    ax.imshow(
        grid.fields[processed_field]["data"][0],
        origin="lower",
        extent=(-40, 40, -40, 40),
    )
    ax.set_title(f"sweep #{sweep + 1}")
plt.show()

print(
    "===\n\nUsing 2D weighting by "
    "setting h_factor and dist_factor z component to 0.0, the max range looks OK now\n\n==="
)
fig2 = plt.figure(figsize=(12, 6), tight_layout=True)
fig2.suptitle("Cartesian gridded")
for sweep, ax_ind in zip([1, 3], range(2)):
    sweep_obj = radar_obj.extract_sweeps((sweep,))
    grid = pyart.map.grid_from_radars(
        (sweep_obj,),
        grid_shape=(1, 1601, 1601),
        grid_limits=((0, 10000.0), [-40000, 40000], [-40000, 40000]),
        fields=[processed_field],
        h_factor=(0.0, 1.0, 1.0),
        dist_factor=(0.0, 1.0, 1.0),
    )
    ax = fig2.add_subplot(1, 2, ax_ind + 1)
    ax.imshow(
        grid.fields[processed_field]["data"][0],
        origin="lower",
        extent=(-40, 40, -40, 40),
    )
    ax.set_title(f"sweep #{sweep + 1}")
plt.show()
Total running time of the script: (0 minutes 6.404 seconds)