Plotting examples#
Plotting real world radar data with Py-ART.
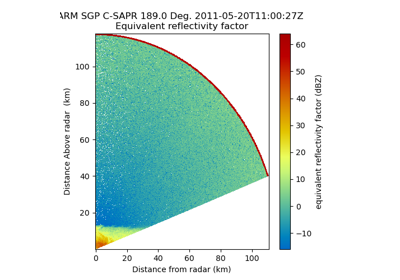
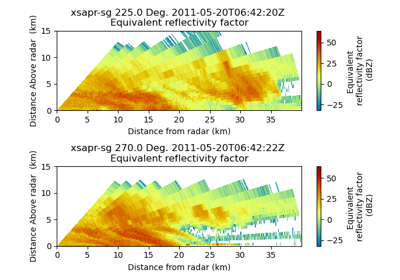
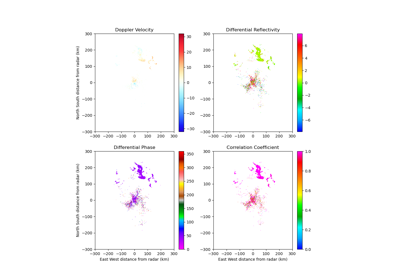
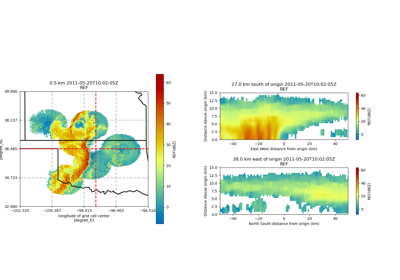
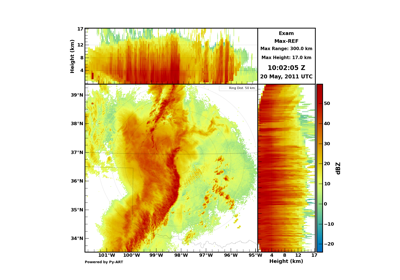
Create a multiple panel RHI plot from a CF/Radial file
Create a multiple panel RHI plot from a CF/Radial file
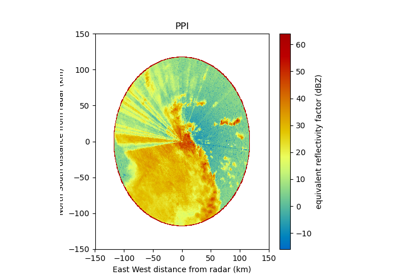
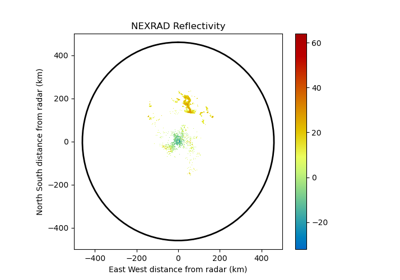
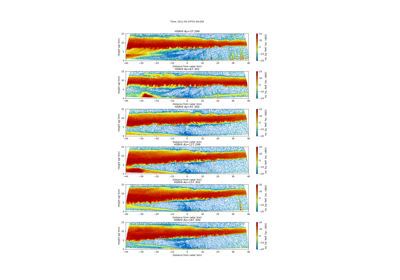
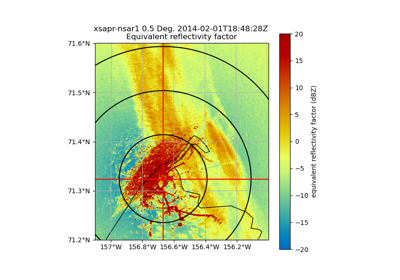
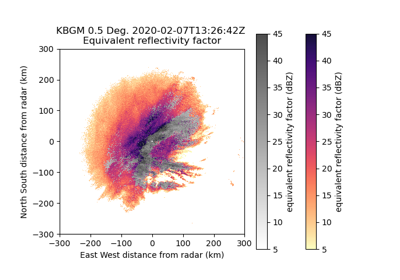
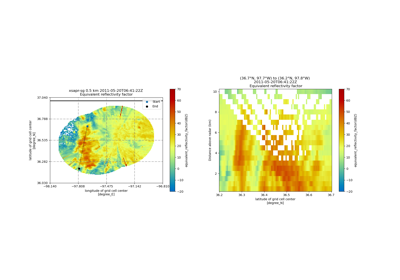
Create a plot of multiple moments from a NEXRAD file
Create a plot of multiple moments from a NEXRAD file
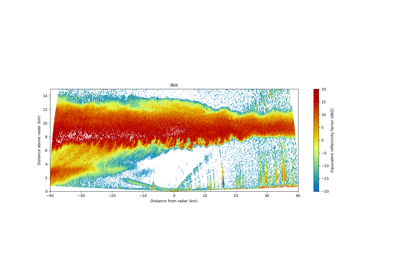
Create a multiple panel RHI plot from a CF/Radial file
Create a multiple panel RHI plot from a CF/Radial file
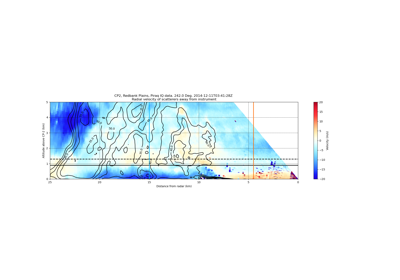
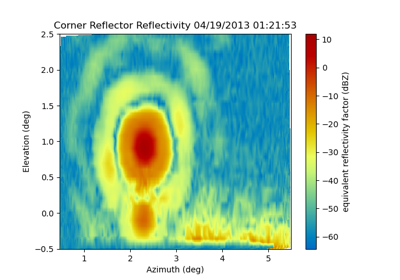
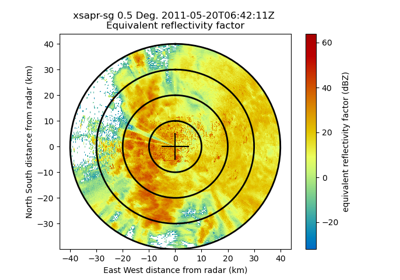
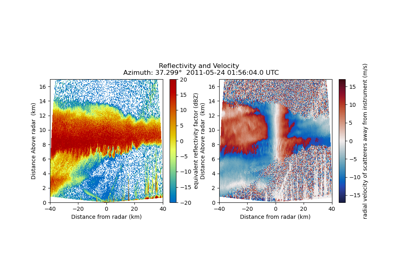
Create an RHI plot with reflectivity contour lines from an MDV file
Create an RHI plot with reflectivity contour lines from an MDV file
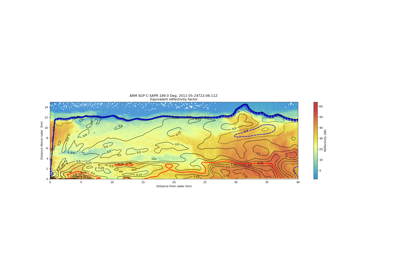
Create an RHI plot with reflectivity contour lines from an MDV file
Create an RHI plot with reflectivity contour lines from an MDV file