Note
Go to the end to download the full example code.
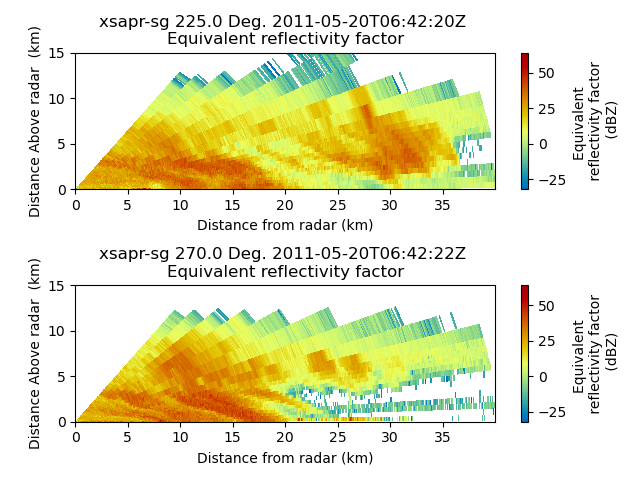
Plot a cross section from a PPI volume#
An example which extracts a cross section at two azimuth angles from a volume of PPI scans and plots both cross sections.
print(__doc__)

# Author: Jonathan J. Helmus (jhelmus@anl.gov)
# License: BSD 3 clause

import matplotlib.pyplot as plt

import pyart
from pyart.testing import get_test_data

# Read the data, a cfradial file
filename = get_test_data("swx_20120520_0641.nc")
radar = pyart.io.read(filename)

# Create a cross section at 225 and 270 degrees azimuth
xsect = pyart.util.cross_section_ppi(radar, [225, 270])

# Set the colorbar label
colorbar_label = "Equivalent \n reflectivity factor \n (dBZ)"

display = pyart.graph.RadarDisplay(xsect)
fig = plt.figure()
ax1 = fig.add_subplot(211)
display.plot(
    "reflectivity_horizontal", 0, vmin=-32, vmax=64.0, colorbar_label=colorbar_label
)
plt.ylim(0, 15)
ax2 = fig.add_subplot(212)
display.plot(
    "reflectivity_horizontal", 1, vmin=-32, vmax=64.0, colorbar_label=colorbar_label
)
plt.ylim(0, 15)

plt.tight_layout()
plt.show()
Total running time of the script: (0 minutes 1.375 seconds)