Input/Output Examples#
Reading/writing a variety of radar data using Py-ART.
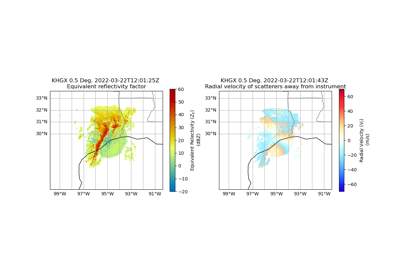
Read and Plot Cfradial2/FM301 data Using Xradar and Py-ART
Read and Plot Cfradial2/FM301 data Using Xradar and Py-ART
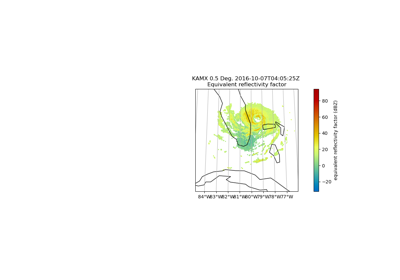
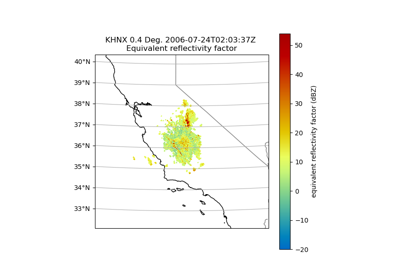
Reading Older NEXRAD Data and Fixing Latitude and Longitude Issues
Reading Older NEXRAD Data and Fixing Latitude and Longitude Issues