Note
Go to the end to download the full example code.
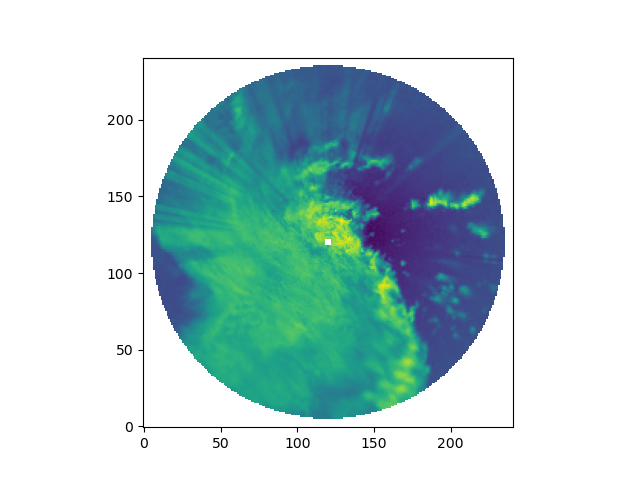
Map a single radar to a Cartesian grid#
Map the reflectivity field of a single radar from Antenna coordinates to a Cartesian grid.
print(__doc__)

# Author: Jonathan J. Helmus (jhelmus@anl.gov)
# License: BSD 3 clause

import matplotlib.pyplot as plt
import numpy as np

import pyart
from pyart.testing import get_test_data

# read in the data
file = get_test_data("110635.mdv")
radar = pyart.io.read_mdv(file)

# mask out last 10 gates of each ray, this removes the "ring" around the radar.
radar.fields["reflectivity"]["data"][:, -10:] = np.ma.masked

# exclude masked gates from the gridding
gatefilter = pyart.filters.GateFilter(radar)
gatefilter.exclude_transition()
gatefilter.exclude_masked("reflectivity")

# perform Cartesian mapping, limit to the reflectivity field.
grid = pyart.map.grid_from_radars(
    (radar,),
    gatefilters=(gatefilter,),
    grid_shape=(1, 241, 241),
    grid_limits=((2000, 2000), (-123000.0, 123000.0), (-123000.0, 123000.0)),
    fields=["reflectivity"],
)

# create the plot
fig = plt.figure()
ax = fig.add_subplot(111)
ax.imshow(grid.fields["reflectivity"]["data"][0], origin="lower")
plt.show()
Total running time of the script: (6 minutes 16.838 seconds)