Note
Go to the end to download the full example code.
Radar-Based Quantitative Precipitation Estimation (QPE)#
This script processes radar data to compute vertical column profiles at a specific point location and estimate rain rates using categorized reflectivity. The rain rates are then saved as a NetCDF file.
The column_profile function extracts a vertical profile at a given latitude/longitude.
The rain_rate_categorized function computes rain rates based on categorized reflectivity.
The script reads multiple radar files, processes them, and visualizes the results.
Note: If you want to increase the area considered for the vertical profile, you can increase azimuth_spread and spatial_spread. Each increment corresponds to the radar’s azimuth resolution and range resolution, respectively.
print(__doc__)
# Author: Hamid Ali Syed (syed@rixvi.com)
# License: BSD 3-Clause
import logging
from datetime import datetime, timezone
import fsspec
import matplotlib.pyplot as plt
import numpy as np
import xarray as xr
import pyart
def column_profile(
radar: pyart.core.Radar,
latitude: float = 33.8,
longitude: float = -88.3,
azimuth_spread: float = 3,
spatial_spread: float = 3,
v_res: float = 100,
min_alt: float = None,
max_alt: float = None,
) -> xr.Dataset:
"""
Extracts a vertical column profile from radar data and interpolates it onto
a uniform height grid.
**Expanding the Area:**
- Increase `azimuth_spread` to expand the azimuthal range.
- Increase `spatial_spread` to include more horizontal coverage.
Parameters
----------
radar : pyart.core.Radar
Py-ART radar object containing volume scan data.
latitude : float, optional
Latitude of the point of interest (default is 33.8).
longitude : float, optional
Longitude of the point of interest (default is -88.3).
azimuth_spread : float, optional
Azimuthal spread in degrees around the point of interest (default is 3).
spatial_spread : float, optional
Horizontal spatial spread in kilometers for averaging (default is 3).
v_res : float, optional
Vertical resolution in meters (default is 100).
min_alt : float
Minimum altitude in meters.
max_alt : float
Maximum altitude in meters.
Returns
-------
xr.Dataset
Interpolated columnar vertical profile on a uniform height grid.
"""
if min_alt is None or max_alt is None:
raise ValueError("Both min_alt and max_alt must be specified.")
col_prof = pyart.util.column_vertical_profile(
radar,
latitude=latitude,
longitude=longitude,
azimuth_spread=azimuth_spread,
spatial_spread=spatial_spread,
)
new_heights = xr.Dataset(
coords={"height": ("height", np.arange(min_alt, max_alt + v_res, v_res))}
)
return col_prof.interp_like(new_heights)
def rain_rate_categorized(
dbz, conv_threshold=40.0, a_conv=300.0, b_conv=1.4, a_strat=200.0, b_strat=1.6
):
"""
Computes rain rate from reflectivity, categorizing into convective and stratiform regions.
"""
Z = 10.0 ** (dbz / 10.0)
is_conv = dbz >= conv_threshold
rr = xr.zeros_like(Z)
rr = xr.where(is_conv, (Z / a_conv) ** (1.0 / b_conv), rr)
rr = xr.where(~is_conv, (Z / a_strat) ** (1.0 / b_strat), rr)
rr.attrs.update(
{
"standard_name": "Rain rate",
"units": "mm/h",
"description": "Rain rate calculated using categorized reflectivity",
}
)
return rr
def download_nexrad(timezone_str, date, site, local_date=False):
"""Download NEXRAD radar data from an S3 bucket."""
try:
if local_date:
# Convert local time to UTC
utc_date = date.replace(tzinfo=timezone.utc)
else:
utc_date = date.replace(tzinfo=timezone.utc)
logging.info(f"Time: {utc_date}")
fs = fsspec.filesystem("s3", anon=True)
nexrad_path = utc_date.strftime(
f"s3://unidata-nexrad-level2/%Y/%m/%d/{site}/{site}%Y%m%d_%H*"
)
files = sorted(fs.glob(nexrad_path))
return [file for file in files if not file.endswith("_MDM")]
except Exception as e:
logging.error("Error in processing: %s", e)
return []
# Load NEXRAD data
site = "KGWX"
timezone_str = "UTC"
date = datetime(2022, 3, 31, 0, 0, tzinfo=timezone.utc)
files = download_nexrad(timezone_str, date, site, local_date=False)[:5]
rain_rate_list = []
for file in files:
radar = pyart.io.read_nexrad_archive("s3://" + file)
col_prof_interp = column_profile(
radar,
latitude=33.5,
longitude=-88.3,
azimuth_spread=3,
spatial_spread=3,
v_res=100,
min_alt=200,
max_alt=8000,
)
rain_rate = rain_rate_categorized(col_prof_interp["reflectivity"])
rain_rate["time"] = col_prof_interp["base_time"]
rain_rate_list.append(rain_rate)
da_rain_rate = xr.concat(rain_rate_list, dim="time")
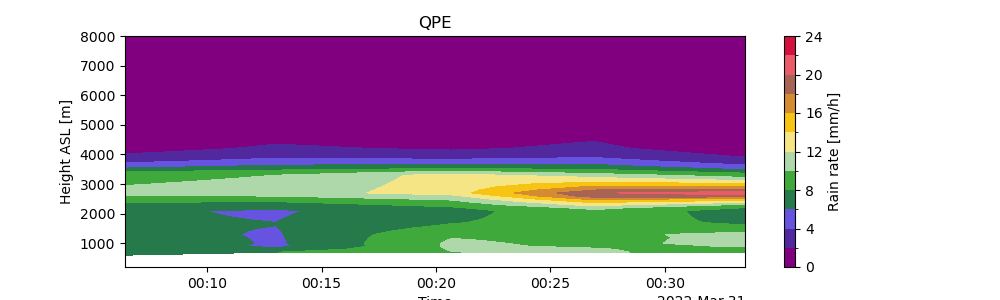
da_rain_rate.plot.contourf(
x="time", levels=range(0, 26, 2), cmap="RRate11", figsize=[10, 3]
)
plt.title("QPE")
plt.xlabel("Time")
plt.ylabel("Height ASL [m]")
plt.show()
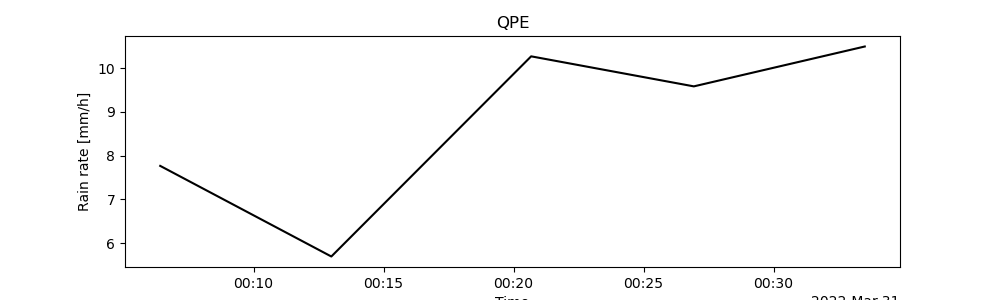
da_rain_rate.sel(height=1000, method="nearest").plot.line("k-", figsize=[10, 3])
plt.title("QPE")
plt.xlabel("Time")
plt.show()
# References
# Steiner, M. R., R. A. Houze Jr., and S. E. Yuter, 1995: Climatological
# Characterization of Three-Dimensional Storm Structure from Operational
# Radar and Rain Gauge Data. J. Appl. Meteor., 34, 1978-2007.
# https://doi.org/10.1175/1520-0450(1995)034<1978:CCOTDS>2.0.CO;2.
Total running time of the script: (0 minutes 22.961 seconds)