Note
Go to the end to download the full example code.
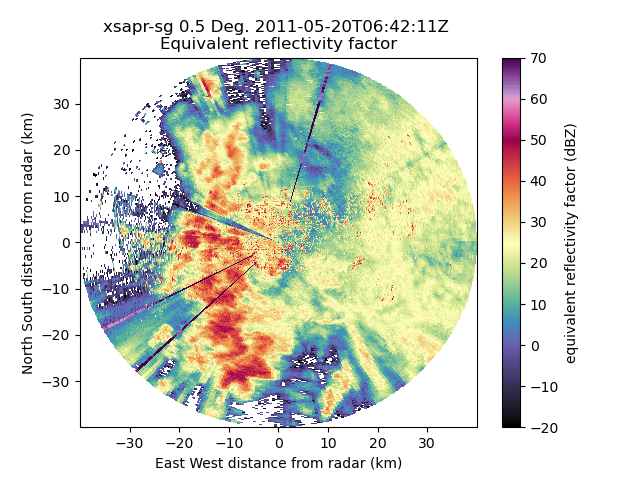
Plot a PPI Using Xradar and Py-ART#
An example which uses xradar and Py-ART to create a PPI plot of a Cfradial file.
# Author: Max Grover (mgrover@anl.gov)
# License: BSD 3 clause


import xradar as xd

import pyart
from pyart.testing import get_test_data

# Locate the test data and read in using xradar
filename = get_test_data("swx_20120520_0641.nc")
tree = xd.io.open_cfradial1_datatree(filename)

# Give the tree Py-ART radar methods
radar = tree.pyart.to_radar()

# Plot the Reflectivity Field (corrected_reflectivity_horizontal)
display = pyart.graph.RadarMapDisplay(radar)
display.plot_ppi(
    "corrected_reflectivity_horizontal", cmap="ChaseSpectral", vmin=-20, vmax=70
)
Total running time of the script: (0 minutes 3.247 seconds)