Ctrl+K

Py-ART 2.0.1 documentation

  • User Guide
  • Example Gallery
  • API Reference Manual
  • Developer’s Guide
  • Blog
    • Notebook Gallery
    • Release Notes
  • GitHub
  • Twitter
  • User Guide
  • Example Gallery
  • API Reference Manual
  • Developer’s Guide
  • Blog
  • Notebook Gallery
  • Release Notes
  • GitHub
  • Twitter

Section Navigation

  • Moment correction examples
    • ZDR Bias Calculation
    • Calculating and Plotting a Cloud Mask
    • Correct reflectivity attenuation
    • Dealias doppler velocities using the Region Based Algorithm
  • Input/Output Examples
    • Read and Plot Cfradial2/FM301 data Using Xradar and Py-ART
    • Reading NEXRAD Data from Google Cloud
    • Reading Older NEXRAD Data and Fixing Latitude and Longitude Issues
    • Reading NEXRAD Data from the AWS Cloud
  • Mapping examples
    • Map a single radar to a Cartesian grid
    • Map two radars to a Cartesian grid
    • Map a single PPI sweep to a Cartesian grid using 2D weighting
    • Compare Two Radars Using Gatemapper
  • Plotting examples
    • Create a RHI plot from a MDV file
    • Plot a Corner Reflector
    • Create a PPI plot from a MDV file
    • Create a PPI plot from a Cfradial file
    • Create a plot of NEXRAD reflectivity
    • Plot a cross section from a PPI volume
    • Create a multiple panel RHI plot from a CF/Radial file
    • Compare PPI vs CAPPI
    • Create a two panel RHI plot
    • Create a plot of multiple moments from a NEXRAD file
    • Create a multiple panel RHI plot from a CF/Radial file
    • Create a 3 panel plot using GridMapDisplay
    • Create a PPI plot on a cartopy map
    • Create an image-muted reflectivity plot
    • Create an RHI plot with reflectivity contour lines from an MDV file
    • Plot a Cross Section from a Grid
    • Modify a Colorbar for your Plot
    • Plot Max-CAPPI
    • Create an RHI plot with reflectivity contour lines from an MDV file
    • Choose a Colormap for your Plot
  • Retrieval Examples
    • Extract a radar column above a point
    • Calculate and Plot Composite Reflectivity
    • Calculate and Plot VAD profile
    • Calculate and Plot hydrometeor classification
    • Radar-Based Quantitative Precipitation Estimation (QPE)
    • Hydrometeor Classification with Custom Frequency Settings
    • Creating a CFAD diagram
    • Convective-Stratiform classification
    • Feature Detection classification
  • Xradar Examples
    • Plot a PPI Using Xradar and Py-ART
    • Grid Data Using Xradar and Py-ART
    • Dealias Radial Velocities Using Xradar and Py-ART
  • Example Gallery
  • Xradar Examples

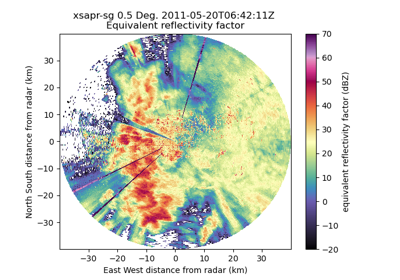
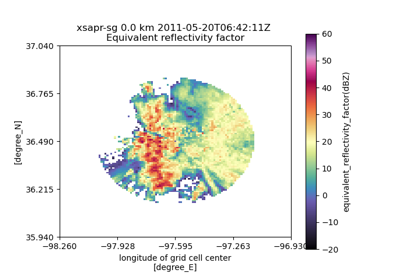
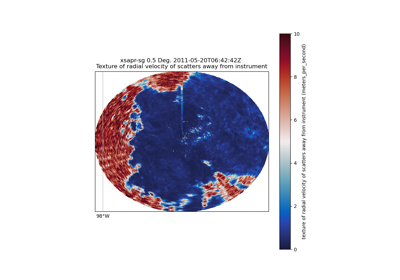
Xradar Examples#

Examples of using Xradar with Py-ART to accomplish different tasks.

Plot a PPI Using Xradar and Py-ART

Plot a PPI Using Xradar and Py-ART

Grid Data Using Xradar and Py-ART

Grid Data Using Xradar and Py-ART

Dealias Radial Velocities Using Xradar and Py-ART

Dealias Radial Velocities Using Xradar and Py-ART

previous

Feature Detection classification

next

Plot a PPI Using Xradar and Py-ART

This Page

  • Show Source

© Copyright 2013-2024, Py-ART developers.

Created using Sphinx 7.1.2.

Built with the PyData Sphinx Theme 0.16.1.