Note
Go to the end to download the full example code.
Reading NEXRAD Data from Google Cloud#
Within this example, we show how you can remotely access Next Generation Weather Radar (NEXRAD) Data from Google Cloud Storage and plot quick looks of the datasets.
print(__doc__)

# Author: Zach Sherman
# License: BSD 3 clause

import tarfile

# This example requires installation of the gcsfs library
import gcsfs
import matplotlib.pyplot as plt

import pyart
Read NEXRAD Level 2 Data#
Let’s start first with NEXRAD Level 2 data, which is ground-based radar data collected by the National Oceanic and Atmospheric Administration (NOAA), as a part of the National Weather Service ### Configure our Filepath for NEXRAD Level 2 Data We will access data from Google cloud storage, with the data organized as:
gcp-public-data-nexrad-l2/year/month/day/radarsite/NWS_NEXRAD_NXL2DPBL_{radarsite}_{year}{month}{date}{hour}0000_{year}{month}{date}{hour}{minute}.tar
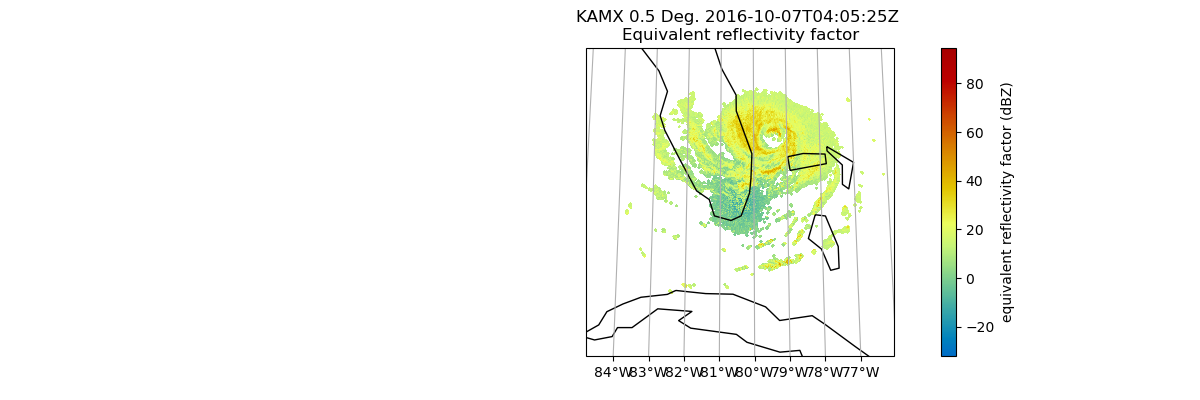
Where in our case, we are using a sample data file from Miami, Florida (KAMX) on October 7, 2016, at 0401:25 UTC. This means our path would look like:
gcs_path = "gcp-public-data-nexrad-l2/2016/10/07/KAMX/NWS_NEXRAD_NXL2DPBL_KAMX_20161007040000_20161007045959.tar"
First we can create a file system and retrieve the tar file to our current directory.
fs = gcsfs.GCSFileSystem()
fs.get(gcs_path, ".")
Could not determine bucket type for bucket name gcp-public-data-nexrad-l2: Your default credentials were not found. To set up Application Default Credentials, see https://cloud.google.com/docs/authentication/external/set-up-adc for more information., falling back to GCSFileSystem
Could not determine bucket type for bucket name gcp-public-data-nexrad-l2: Your default credentials were not found. To set up Application Default Credentials, see https://cloud.google.com/docs/authentication/external/set-up-adc for more information., falling back to GCSFileSystem
Could not determine bucket type for bucket name gcp-public-data-nexrad-l2: Your default credentials were not found. To set up Application Default Credentials, see https://cloud.google.com/docs/authentication/external/set-up-adc for more information., falling back to GCSFileSystem

[None]
The we can use the tarfile module to extract the files within.
file = tarfile.open("NWS_NEXRAD_NXL2DPBL_KAMX_20161007040000_20161007045959.tar")
members = file.getmembers()

# This case we are getting only the first file.
file.extract(members[0].name, ".", filter="data")
file.close()
We can use the pyart.io.read_nexrad_archive module to access our data, passing in the member filepath.
radar = pyart.io.read_nexrad_archive(members[0].name)
Let’s take a look at a summary of what fields are available.
print(list(radar.fields))
['reflectivity', 'velocity', 'differential_phase', 'spectrum_width', 'cross_correlation_ratio', 'differential_reflectivity']
Let’s plot the reflectivity field as a first step to investigating our dataset.
fig = plt.figure(figsize=(12, 4))
display = pyart.graph.RadarMapDisplay(radar)

display.plot_ppi_map("reflectivity")
plt.show()
Total running time of the script: (0 minutes 28.551 seconds)