Note
Go to the end to download the full example code.
Reading Older NEXRAD Data and Fixing Latitude and Longitude Issues#
In this example, we will show how to read in older NEXRAD files prior to 2008 that are missing some coordinate metadata.
print(__doc__)


# Author: Zachary Sherman (zsherman@anl.gov)
# License: BSD 3 clause
Import our required packages.
import cartopy.crs as ccrs
import matplotlib.pyplot as plt

import pyart
Read older NEXRAD Level 2 Data#
Older NEXRAD files prior to 2008, have the tendency to not contain some of the required metadata for Py-ART’s NEXRAD reader. This usually results in missing latitude and longitude data, so after reading with Py-ART, both coordinates have a value of 0. This example, we will show how to properly read in an older NEXRAD file.
First we want to get an older file from amazon web service:
s3://unidata-nexrad-level2/year/month/date/radarsite/{radarsite}{year}{month}{date}_{hour}{minute}{second}.gz
Where in our case, we are using a sample data file from Handford, CA (KHNX) on July 24, 2006, at 0203:38 UTC. This means our path would look like this:
# Note: Older files do not contain the 'V06' but instead '.gz' in the AWS path.

aws_nexrad_level2_file = (
    "s3://unidata-nexrad-level2/2006/07/24/KHNX/KHNX20060724_020338.gz"
)
We can use the pyart.io.read_nexrad_archive module to access our data, passing in the filepath.
radar = pyart.io.read_nexrad_archive(aws_nexrad_level2_file)
Now let us take a look at the radar latitude and longitude data.
print(radar.latitude["data"])
print(radar.longitude["data"])
[0.]
[0.]
This is clearly not correct! The problem is the reader could not find the metadata (message 31) for the coordinates.
Lucky for us, we can provide the station in Py-ART’s NEXRAD reader, which will pull the coordinate information from a dictionary found within Py-ART.
radar = pyart.io.read_nexrad_archive(aws_nexrad_level2_file, station="KHNX")
Again, let us take a look at the radar latitude and longitude data.
print(radar.latitude["data"])
print(radar.longitude["data"])
[36.31417]
[-119.63111]
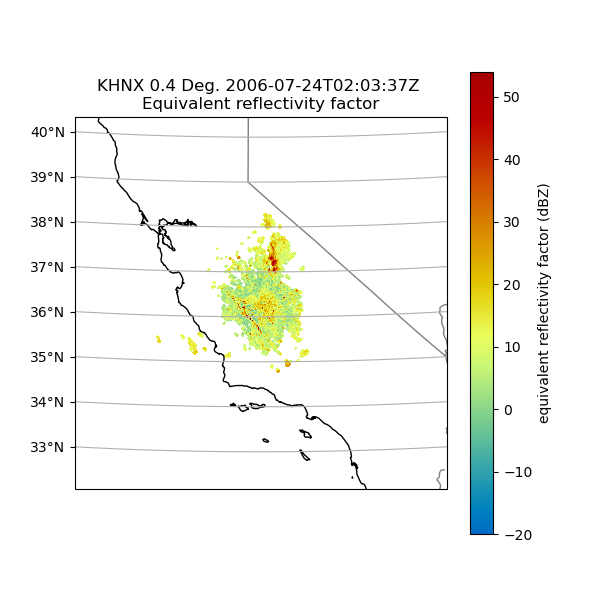
Everything now looks correct as this is in Handford CA!
# We can create a plot as well utilizing Cartopy to see how it looks.
display = pyart.graph.RadarMapDisplay(radar)

# Setting projection and ploting the first tilt.
projection = ccrs.LambertConformal(
    central_latitude=radar.latitude["data"][0],
    central_longitude=radar.longitude["data"][0],
)

fig = plt.figure(figsize=(6, 6))
display.plot_ppi_map(
    "reflectivity", 0, vmin=-20, vmax=54, projection=projection, resolution="10m"
)
Total running time of the script: (0 minutes 8.504 seconds)