Note
Go to the end to download the full example code.
Extract a radar column above a point#
Given a radar and a point, extract the column of radar data values above a point
# Author: Maxwell Grover (mgrover@anl.gov)
# License: BSD 3 clause

import cartopy.crs as ccrs
import matplotlib.pyplot as plt
import numpy as np

import pyart
from pyart.testing import get_test_data

# Read in some test data
filename = get_test_data("swx_20120520_0641.nc")
radar = pyart.io.read(filename)
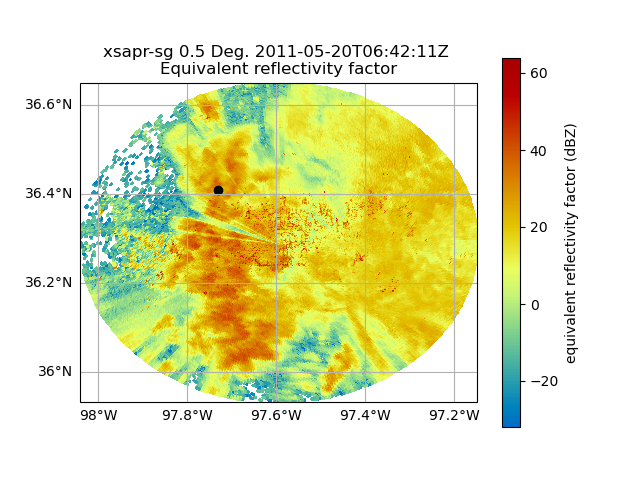
Plot the first sweep and our desired point
Let’s visualize our radar data from a single sweep, and plot the location of our desired point on a map. This will provide some context as to where we are extracting our column of values.
site_lon = -97.73  # longitude in degrees
site_lat = 36.41  # latitdue in degrees

# Setup the RadarMapDisplay and add our projection
display = pyart.graph.RadarMapDisplay(radar)
ax = plt.subplot(111, projection=ccrs.PlateCarree())

# Visualize the reflectivity field, using the lowest sweep with
# latitude and longitude lines
display.plot_ppi_map(
    "reflectivity_horizontal",
    0,
    ax=ax,
    vmin=-32,
    vmax=64.0,
    lon_lines=np.arange(-98, -97, 0.2),
    lat_lines=np.arange(36, 37, 0.2),
)

# Plot our site location on top of the radar image
ax.scatter(site_lon, site_lat, color="black")
<matplotlib.collections.PathCollection object at 0x7f0a5ea94b90>
Now that we have our point defined, and our radar object, we can use the following utility function in Py-ART to subset a column
This function returns an xarray dataset, with all of our data fields!
print(ds)
<xarray.Dataset> Size: 2kB
Dimensions:                            (height: 22)
Coordinates:
  * height                             (height) float64 176B 350.6 ... 1.818e+04
Data variables: (12/15)
    corrected_reflectivity_horizontal  (height) float64 176B 39.2 37.52 ... nan
    reflectivity_horizontal            (height) float64 176B 32.88 31.46 ... nan
    recalculated_diff_phase            (height) float64 176B 1.555 1.32 ... -0.0
    specific_attenuation               (height) float64 176B 0.2778 ... 0.0
    unf_dp_phase_shift                 (height) float32 88B 58.05 ... 36.27
    mean_doppler_velocity              (height) float32 88B -9.133 ... 5.688
    ...                                 ...
    dp_phase_shift                     (height) float64 176B 145.5 144.0 ... nan
    diff_reflectivity                  (height) float32 88B 0.0 0.0 ... 0.0 0.0
    proc_dp_phase_shift                (height) float32 88B 51.8 50.25 ... 36.27
    copol_coeff                        (height) float64 176B 0.95 0.92 ... nan
    base_time                          datetime64[ns] 8B 2011-05-20T06:42:11
    time_offset                        (height) datetime64[ns] 176B 2011-05-2...
Attributes:
    distance_from_radar:    15.113 km
    azimuth:                233.545 degrees
    latitude_of_location:   36.41 degrees
    longitude_of_location:  -97.73 degrees
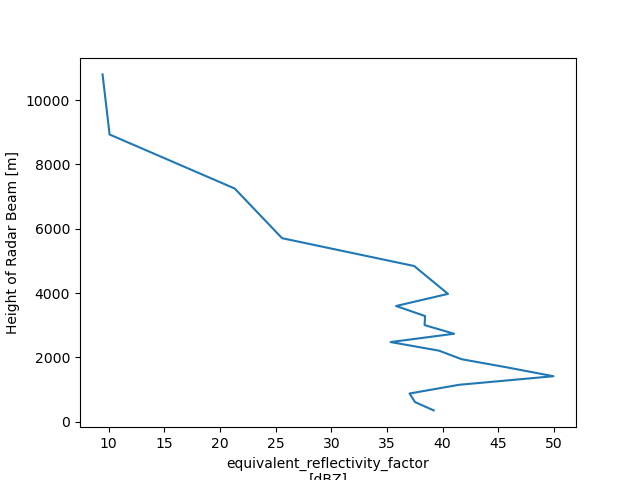
Visualize the Reflectivity Values in the Column
Let’s visualize the reflectivity values in the column above our point, which is stored in our new dataset
ds.corrected_reflectivity_horizontal.plot(y="height")
[<matplotlib.lines.Line2D object at 0x7f0a5f05de50>]
Total running time of the script: (0 minutes 2.183 seconds)