Note
Go to the end to download the full example code.
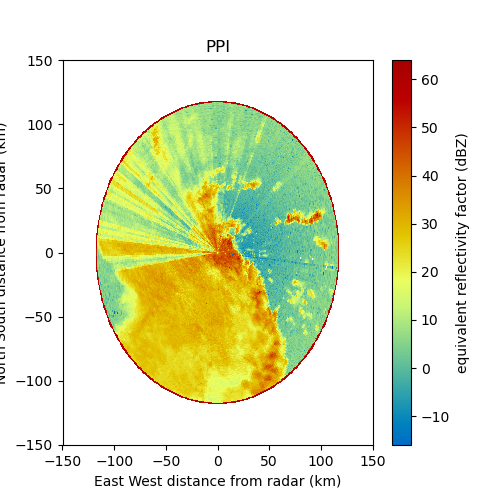
Create a PPI plot from a MDV file#
An example which creates a PPI plot of a MDV file using a RadarDisplay object.
print(__doc__)

# Author: Jonathan J. Helmus (jhelmus@anl.gov)
# License: BSD 3 clause

import matplotlib.pyplot as plt

import pyart
from pyart.testing import get_test_data

filename = get_test_data("110635.mdv")

# create the plot using RadarDisplay
radar = pyart.io.read_mdv(filename)
display = pyart.graph.RadarDisplay(radar)
fig = plt.figure(figsize=[5, 5])
ax = fig.add_subplot(111)
display.plot("reflectivity", 0, vmin=-16.0, vmax=64, title="PPI", cmap="HomeyerRainbow")
display.set_limits(ylim=[-150, 150], xlim=[-150, 150])
plt.show()
Total running time of the script: (0 minutes 2.122 seconds)