Note
Go to the end to download the full example code.
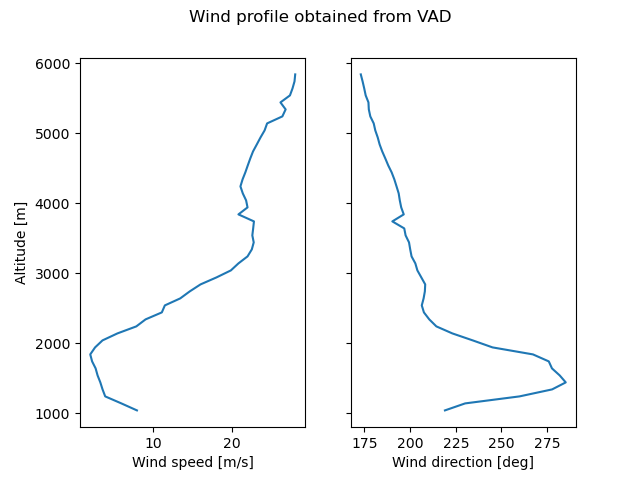
Calculate and Plot VAD profile#
Calculates a VAD and plots a vertical profile of wind
max height 2682.5470354519784  meters
min height -53.447328651323915  meters
max height 5273.055615736172  meters
min height 1.7533807586878538  meters
max height 7815.51210340485  meters
min height 4.341798234730959  meters
max height 10403.798749463633  meters
min height 6.977668723091483  meters
max height 14259.735154148191  meters
min height 10.905980195850134  meters
max height 18533.70608163625  meters
min height 15.262251073494554  meters
max height 22800.97541932203  meters
min height 19.613871516659856  meters
max height 27060.25919727981  meters
min height 23.959520922973752  meters
max height 31310.269606200978  meters
min height 28.29787217825651  meters
max height 35549.73140401952  meters
min height 32.62760841473937  meters
max height 39777.36820153147  meters
min height 36.94740904122591  meters
max height 43991.90973467566  meters
min height 41.25595719181001  meters
max height 50263.42219179496  meters
min height 47.671291364356875  meters
max height 58621.52730140835  meters
min height 56.22838316485286  meters
max height 71003.14627731778  meters
min height 68.92013945430517  meters
max height 87118.5253265705  meters
min height 85.4666496720165  meters
max height 106741.22752280161  meters
min height 105.65626102685928  meters
max height 125477.00644101389  meters
min height 124.97631322406232  meters
max height 143293.15816160105  meters
min height 143.38701202347875  meters
max height 160000.28993562795  meters
min height 160.68618156574667  meters

Text(0.5, 0.98, 'Wind profile obtained from VAD')
# Author: Daniel Wolfensberger (daniel.wolfensberger@meteoswiss.ch)
# License: BSD 3 clause

import matplotlib.pyplot as plt
import numpy as np
from open_radar_data import DATASETS

import pyart

# Read in a sample file
filename = DATASETS.fetch("MLA2119412050U.nc")
radar = pyart.io.read_cfradial(filename)

# Loop on all sweeps and compute VAD
zlevels = np.arange(100, 5000, 100)  # height above radar
u_allsweeps = []
v_allsweeps = []

for idx in range(radar.nsweeps):
    radar_1sweep = radar.extract_sweeps([idx])
    vad = pyart.retrieve.vad_browning(
        radar_1sweep, "corrected_velocity", z_want=zlevels
    )
    u_allsweeps.append(vad.u_wind)
    v_allsweeps.append(vad.v_wind)

# Average U and V over all sweeps and compute magnitude and angle
u_avg = np.nanmean(np.array(u_allsweeps), axis=0)
v_avg = np.nanmean(np.array(v_allsweeps), axis=0)
orientation = np.rad2deg(np.arctan2(-u_avg, -v_avg)) % 360
speed = np.sqrt(u_avg**2 + v_avg**2)

# Display vertical profile of wind
fig, ax = plt.subplots(1, 2, sharey=True)
ax[0].plot(speed * 2, zlevels + radar.altitude["data"])
ax[1].plot(orientation, zlevels + radar.altitude["data"])
ax[0].set_xlabel("Wind speed [m/s]")
ax[1].set_xlabel("Wind direction [deg]")
ax[0].set_ylabel("Altitude [m]")
fig.suptitle("Wind profile obtained from VAD")
Total running time of the script: (0 minutes 2.979 seconds)