Retrieval Examples#
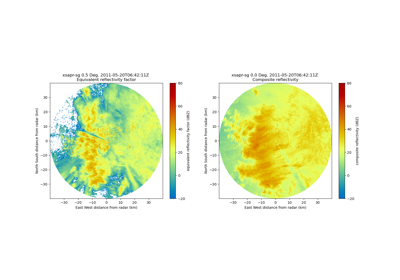
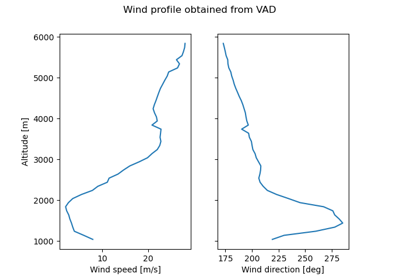
Retrievals from various radars, such as additional fields or subsets of the data.
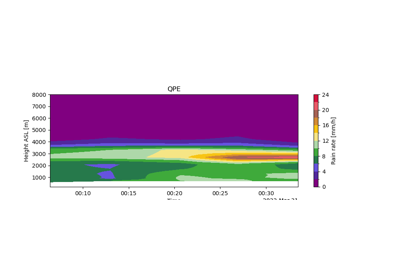
Radar-Based Quantitative Precipitation Estimation (QPE)
Radar-Based Quantitative Precipitation Estimation (QPE)
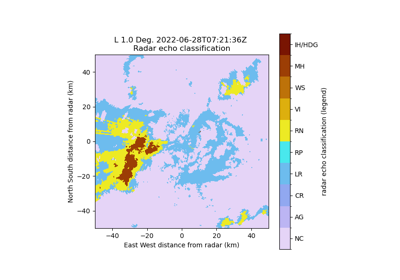
Hydrometeor Classification with Custom Frequency Settings
Hydrometeor Classification with Custom Frequency Settings