Note
Go to the end to download the full example code.
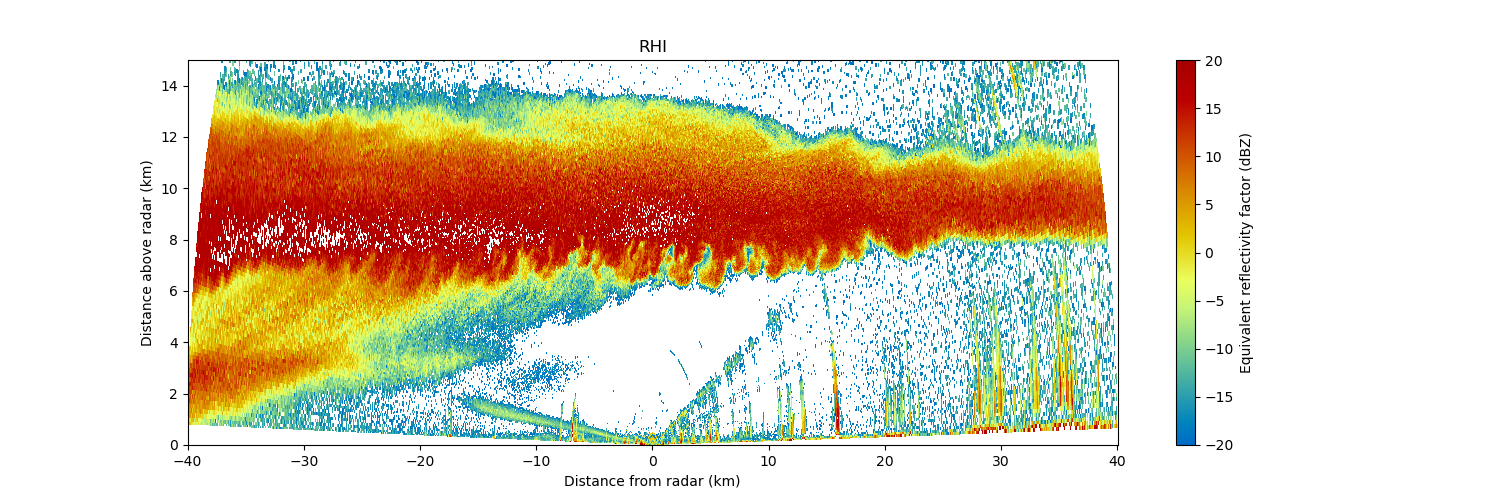
Create a multiple panel RHI plot from a CF/Radial file#
An example which creates a RHI plot of a CF/Radial file using a RadarDisplay object.
print(__doc__)

import matplotlib.pyplot as plt

import pyart
from pyart.testing import get_test_data

filename = get_test_data("sgpxsaprrhicmacI5.c0.20110524.015604_NC4.nc")

# create the plot using RadarDisplay
radar = pyart.io.read_cfradial(filename)
radar.metadata["instrument_name"] = "XSARP"
display = pyart.graph.RadarDisplay(radar)

fig = plt.figure(figsize=[15, 5])
fig.subplots_adjust(hspace=0.4)
xlabel = "Distance from radar (km)"
ylabel = "Distance above radar (km)"
colorbar_label = "Equivalent reflectivity factor (dBZ)"
# nplots = radar.nsweeps

fixed_angle = radar.fixed_angle["data"][0]
title = f"HSRHI Az={fixed_angle:.3f}"
ax = fig.add_subplot(1, 1, 1)
display.plot(
    "reflectivity_horizontal",
    0,
    vmin=-20,
    vmax=20,
    mask_outside=True,
    title="RHI",
    axislabels=(xlabel, ylabel),
    cmap="HomeyerRainbow",
    colorbar_label=colorbar_label,
    ax=ax,
)
display.set_limits(ylim=[0, 15], ax=ax)

plt.show()
Total running time of the script: (0 minutes 31.551 seconds)