Note
Go to the end to download the full example code.
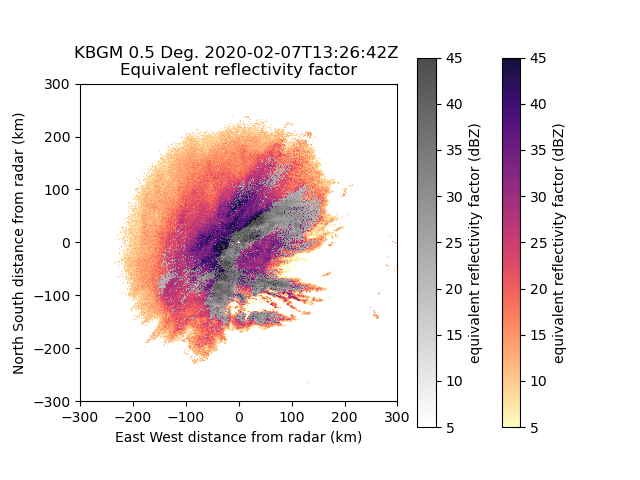
Create an image-muted reflectivity plot#
An example which creates an image-muted PPI plot from a NEXRAD file.
Image muting reduces the visual prominence of the reflectivities within identified melting and mixed precipitation features in winter storms (i.e. regions with low correlation coefficient values). Reflectivities corresponding to melting and mixed precipitation features are deemphasized using a gray scale and the regions with just snow and just rain are depicted in a corresponding full-color scale. The ultimate utility of image muting radar reflectivity is to reduce the misinterpretation of regions of melting or mixed precipitation as opposed to heavy snow or heavy rain. See Tomkins et al. (2022) for full details.
print(__doc__)

# Author: Laura Tomkins (lauramtomkins@gmail.com)
# License: BSD 3 clause

import matplotlib.colors as mcolors
import matplotlib.pyplot as plt
import numpy as np

import pyart

# Read in file
nexrad_file = "s3://unidata-nexrad-level2/2020/02/07/KBGM/KBGM20200207_132642_V06"
radar = pyart.io.read_nexrad_archive(nexrad_file)

# Mute radar object
# Regions where rhoHV < 0.97 and reflectivity > 20 will be muted
radar = pyart.util.image_mute_radar(
    radar,
    field="reflectivity",
    mute_field="cross_correlation_ratio",
    mute_threshold=0.97,
    field_threshold=20,
)

# adjust colormaps for visual separation
# this example uses perceptually uniform colormaps
magma_cmap = plt.get_cmap("magma_r")
grays_cmap = plt.get_cmap("gray_r")

nonmuted_cmap = mcolors.LinearSegmentedColormap.from_list(
    "nonmuted_cmap", magma_cmap(np.linspace(0, 0.9, magma_cmap.N))
)
muted_cmap = mcolors.LinearSegmentedColormap.from_list(
    "muted_cmap", grays_cmap(np.linspace(0, 0.7, grays_cmap.N))
)

# create plot using RadarDisplay
display = pyart.graph.RadarDisplay(radar)

fig = plt.figure()
ax = plt.axes()
display.plot("nonmuted_reflectivity", 0, vmin=5, vmax=45, cmap=nonmuted_cmap)
display.plot("muted_reflectivity", 0, vmin=5, vmax=45, cmap=muted_cmap)
display.set_limits((-300, 300), (-300, 300))
ax.set_aspect("equal")
plt.show()

# References
# ----------
# Tomkins, L. M., Yuter, S. E., Miller, M. A., and Allen, L. R., 2022:
# Image muting of mixed precipitation to improve identification of regions
# of heavy snow in radar data. Atmos. Meas. Tech., 15, 5515–5525,
# https://doi.org/10.5194/amt-15-5515-2022
Total running time of the script: (0 minutes 4.253 seconds)