Note
Go to the end to download the full example code.
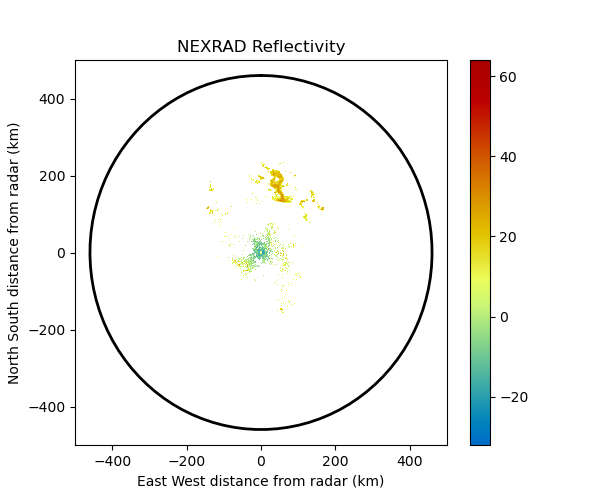
Create a plot of NEXRAD reflectivity#
An example which creates a plot containing the first collected scan from a NEXRAD file.
print(__doc__)

# Author: Jonathan J. Helmus (jhelmus@anl.gov)
# License: BSD 3 clause

import matplotlib.pyplot as plt

import pyart
from pyart.testing import get_test_data

# open the file, create the displays and figure
filename = get_test_data("Level2_KATX_20130717_1950.ar2v")
radar = pyart.io.read_nexrad_archive(filename)
display = pyart.graph.RadarDisplay(radar)
fig = plt.figure(figsize=(6, 5))

# plot super resolution reflectivity
ax = fig.add_subplot(111)
display.plot(
    "reflectivity",
    0,
    title="NEXRAD Reflectivity",
    vmin=-32,
    vmax=64,
    colorbar_label="",
    ax=ax,
)
display.plot_range_ring(radar.range["data"][-1] / 1000.0, ax=ax)
display.set_limits(xlim=(-500, 500), ylim=(-500, 500), ax=ax)
plt.show()
Total running time of the script: (0 minutes 6.711 seconds)