Note
Go to the end to download the full example code.
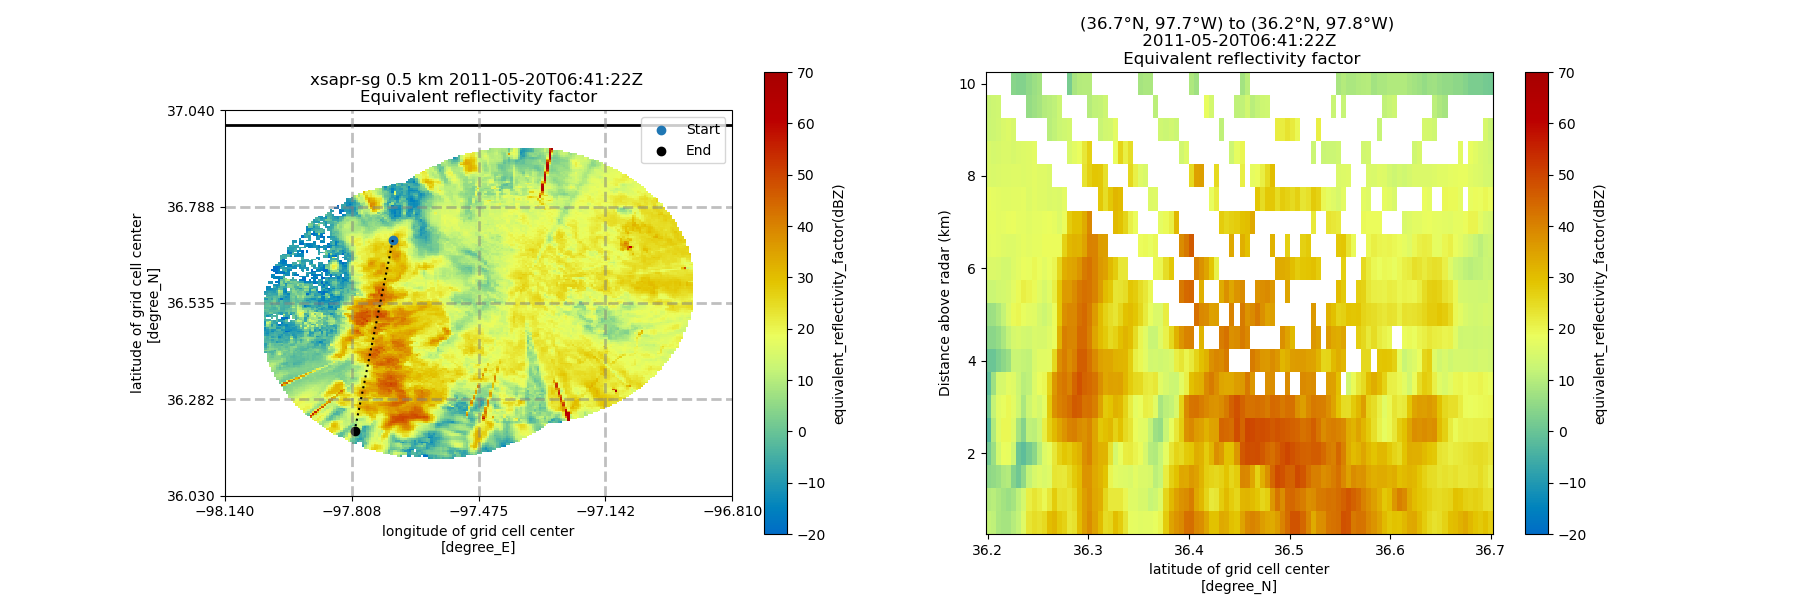
Plot a Cross Section from a Grid#
This is an example of how to plot a cross section of your radar grid using the GridMapDisplay
print(__doc__)

# Author: Max Grover (mgrover@anl.gov)
# License: BSD 3 clause

import cartopy.crs as ccrs
import matplotlib.pyplot as plt

import pyart
from pyart.testing import get_test_data

# Read in the data from two XSAPR radars
xsapr_sw_file = get_test_data("swx_20120520_0641.nc")
xsapr_se_file = get_test_data("sex_20120520_0641.nc")
radar_sw = pyart.io.read_cfradial(xsapr_sw_file)
radar_se = pyart.io.read_cfradial(xsapr_se_file)

# Filter out gates with reflectivity > 100 from both radars
gatefilter_se = pyart.filters.GateFilter(radar_se)
gatefilter_se.exclude_transition()
gatefilter_se.exclude_above("corrected_reflectivity_horizontal", 100)
gatefilter_sw = pyart.filters.GateFilter(radar_sw)
gatefilter_sw.exclude_transition()
gatefilter_sw.exclude_above("corrected_reflectivity_horizontal", 100)

# perform Cartesian mapping, limit to the reflectivity field.
grid = pyart.map.grid_from_radars(
    (radar_se, radar_sw),
    gatefilters=(gatefilter_se, gatefilter_sw),
    grid_shape=(20, 181, 181),
    grid_limits=((500, 10000), (-50000, 40000), (-60000, 40000)),
    grid_origin=(36.57861, -97.363611),
    fields=["corrected_reflectivity_horizontal"],
)

# Define some start and end points, using (latitude, longitude)
start = (36.7, -97.7)
end = (36.2, -97.8)

# Setup the figure, and plot our x/y view of the radar
fig = plt.figure(figsize=(18, 6))
ax1 = plt.subplot(121, projection=ccrs.PlateCarree())
display = pyart.graph.GridMapDisplay(grid)
display.plot_grid(
    "corrected_reflectivity_horizontal",
    ax=ax1,
    cmap="HomeyerRainbow",
    vmin=-20,
    vmax=70,
)

# Plot our start and end points, as well as a line in between the two
ax1.scatter(start[1], start[0], color="tab:blue", label="Start")
ax1.scatter(end[1], end[0], color="black", label="End")
ax1.plot([start[1], end[1]], [start[0], end[0]], color="k", linestyle=":")
plt.legend(loc="upper right")

# Add a cross section, using our start and end points, and set our x-axis as latitude (lat)
ax2 = plt.subplot(122)
display.plot_cross_section(
    "corrected_reflectivity_horizontal",
    start,
    end,
    x_axis="lat",
    cmap="HomeyerRainbow",
    vmin=-20,
    vmax=70,
)
Total running time of the script: (0 minutes 8.429 seconds)