Note
Go to the end to download the full example code.
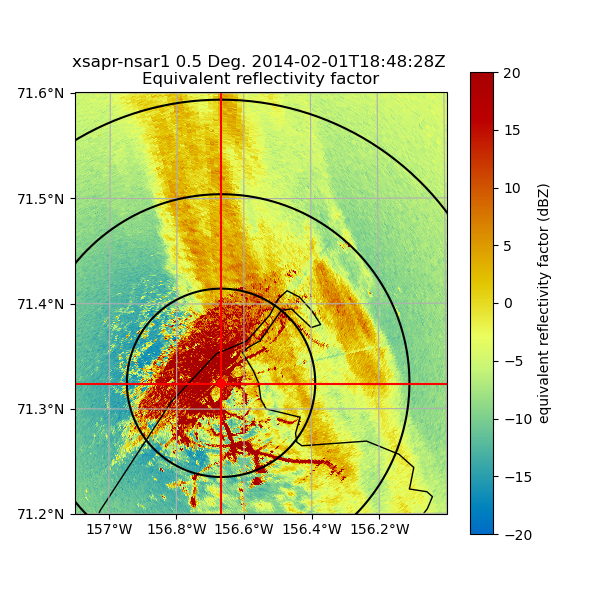
Create a PPI plot on a cartopy map#
An example which creates a PPI plot of a file with a cartopy background and range rings
print(__doc__)

# Author: Jason Hemedinger
# License: BSD 3 clause

import cartopy.crs as ccrs
import matplotlib.pyplot as plt
import numpy as np

import pyart
from pyart.testing import get_test_data

# Read in the file, create a RadarMapDisplay object
filename = get_test_data("nsaxsaprppiC1.a1.20140201.184802.nc")
radar = pyart.io.read(filename)
display = pyart.graph.RadarMapDisplay(radar)

# Setting projection and ploting the second tilt
projection = ccrs.LambertConformal(
    central_latitude=radar.latitude["data"][0],
    central_longitude=radar.longitude["data"][0],
)

fig = plt.figure(figsize=(6, 6))
display.plot_ppi_map(
    "reflectivity_horizontal",
    1,
    vmin=-20,
    vmax=20,
    min_lon=-157.1,
    max_lon=-156,
    min_lat=71.2,
    max_lat=71.6,
    lon_lines=np.arange(-158, -154, 0.2),
    resolution="10m",
    lat_lines=np.arange(69, 72, 0.1),
    projection=projection,
    fig=fig,
    lat_0=radar.latitude["data"][0],
    lon_0=radar.longitude["data"][0],
)

# Plot range rings at 10, 20, 30, 40km
display.plot_range_ring(10.0, line_style="k-")
display.plot_range_ring(20.0, line_style="k--")
display.plot_range_ring(30.0, line_style="k-")
display.plot_range_ring(40.0, line_style="k--")

# Plot cross hairs
display.plot_line_xy(
    np.array([-40000.0, 40000.0]), np.array([0.0, 0.0]), line_style="k-"
)
display.plot_line_xy(
    np.array([0.0, 0.0]), np.array([-20000.0, 200000.0]), line_style="k-"
)

# Indicate the radar location with a point
display.plot_point(radar.longitude["data"][0], radar.latitude["data"][0])

plt.show()
Total running time of the script: (4 minutes 31.857 seconds)