Note
Go to the end to download the full example code.
Compare VAD Wind Profiles from Two Methods#
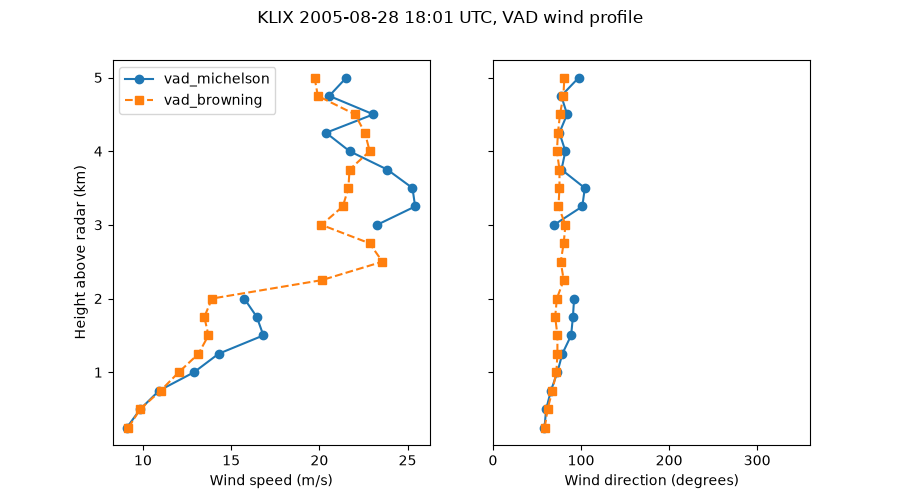
Retrieves a wind profile from a NEXRAD volume with both VAD methods in
Py-ART, vad_michelson and vad_browning, and plots them together.
The data are from KLIX (New Orleans) at 18:01 UTC on 28 August 2005, as the outer bands of Hurricane Katrina reached the radar.
# Author: Max Grover (mgrover@anl.gov)
# License: BSD 3 clause

import matplotlib.pyplot as plt
import numpy as np
from open_radar_data import DATASETS

import pyart

# Read in the file
filename = DATASETS.fetch("KLIX20050828_180149.gz")
radar = pyart.io.read(filename)
Filter and dealias the velocities
A VAD fits a sine wave to the radial velocities around each range ring, so the velocities must be dealiased first. Gates without a usable echo are masked, and both methods leave masked gates out of the fit.
gatefilter = pyart.filters.GateFilter(radar)
gatefilter.exclude_transition()
gatefilter.exclude_invalid("velocity")
gatefilter.exclude_invalid("reflectivity")
gatefilter.exclude_outside("reflectivity", 0, 80)
corrected_velocity = pyart.correct.dealias_region_based(radar, gatefilter=gatefilter)
radar.add_field("corrected_velocity", corrected_velocity, replace_existing=True)
Retrieve the wind profile
Compute a VAD for each sweep that has velocity data, then take the median over sweeps at each height.
vad_michelson estimates the error of every gate’s fit and leaves out
gates whose speed error is above max_speed_error (2 m/s by default).
The error is large when a gate has few valid rays, when they are bunched in
one part of the circle, or when the data are noisy. The remaining gates are
averaged into height bins, weighted by their confidence.
zlevels = np.arange(250, 5001, 250)  # height above radar (m)


def median_profile(vad_function):
    u_all, v_all = [], []
    for sweep in range(radar.nsweeps):
        if radar.get_field(sweep, "corrected_velocity").count() == 0:
            continue
        one_sweep = radar.extract_sweeps([sweep])
        vad = vad_function(one_sweep, "corrected_velocity", z_want=zlevels)
        u_all.append(np.ma.filled(vad.u_wind, np.nan))
        v_all.append(np.ma.filled(vad.v_wind, np.nan))
    u = np.nanmedian(u_all, axis=0)
    v = np.nanmedian(v_all, axis=0)
    speed = np.hypot(u, v)
    direction = np.rad2deg(np.arctan2(-u, -v)) % 360
    return speed, direction


michelson_speed, michelson_direction = median_profile(pyart.retrieve.vad_michelson)
browning_speed, browning_direction = median_profile(pyart.retrieve.vad_browning)
max height 30331.0 meters
max height 39793.0 meters
max height 46089.0 meters
max height 54815.0 meters
max height 61431.0 meters
max height 70805.0 meters
max height 80144.0 meters
max height 90818.0 meters
max height 105868.0 meters
max height 121124.0 meters
max height 142550.0 meters
max height 162633.0 meters
max height 10793.0  meters
min height 103.0  meters
max height 10083.0  meters
min height 157.0  meters
max height 11929.0  meters
min height 193.0  meters
max height 12427.0  meters
min height 243.0  meters
max height 11819.0  meters
min height 281.0  meters
max height 10332.0  meters
min height 80.0  meters
max height 10561.0  meters
min height 92.0  meters
max height 11111.0  meters
min height 107.0  meters
max height 1616.0  meters
min height 127.0  meters
max height 1223.0  meters
min height 149.0  meters
max height 893.0  meters
min height 178.0  meters
max height 785.0  meters
min height 206.0  meters
Plot the two profiles
fig, (ax_speed, ax_direction) = plt.subplots(1, 2, figsize=(9, 5), sharey=True)
height_km = zlevels / 1000

ax_speed.plot(michelson_speed, height_km, marker="o", label="vad_michelson")
ax_speed.plot(browning_speed, height_km, marker="s", ls="--", label="vad_browning")
ax_speed.set_xlabel("Wind speed (m/s)")
ax_speed.set_ylabel("Height above radar (km)")
ax_speed.legend()

ax_direction.plot(michelson_direction, height_km, marker="o")
ax_direction.plot(browning_direction, height_km, marker="s", ls="--")
ax_direction.set_xlabel("Wind direction (degrees)")
ax_direction.set_xlim(0, 360)

fig.suptitle("KLIX 2005-08-28 18:01 UTC, VAD wind profile")
plt.show()
Total running time of the script: (0 minutes 3.770 seconds)