Note
Go to the end to download the full example code.
Plot an RHI Using Xradar and Py-ART#
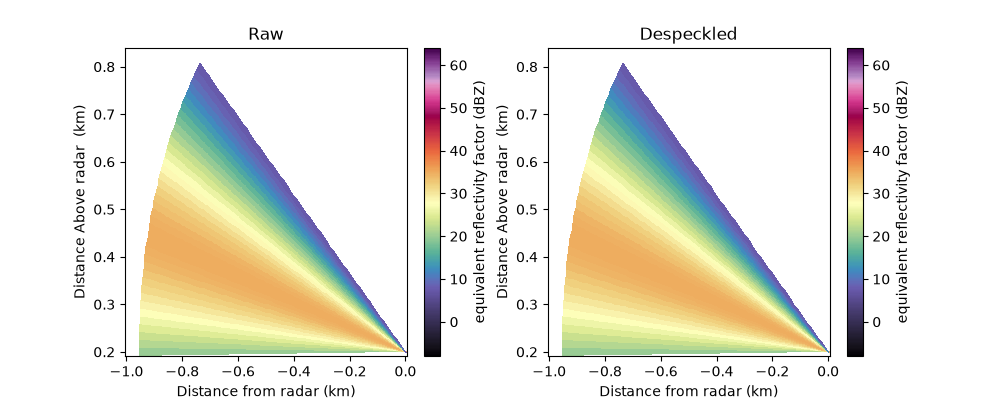
An example which uses xradar and Py-ART to create a range height indicator
(RHI) plot and run a Py-ART algorithm on an RHI volume wrapped by Xradar.
Since open_radar_data does not currently ship an RHI file that reads
cleanly through xradar/Py-ART, this example builds a synthetic RHI volume
with pyart.testing.make_empty_rhi_radar(), round-trips it through
CfRadial to obtain an xradar DataTree, and wraps it with Xradar.
# Author: Py-ART developers
# License: BSD 3 clause

import tempfile
from pathlib import Path

import matplotlib.pyplot as plt
import numpy as np
import xradar as xd

import pyart

# Build a synthetic RHI Radar object and add a reflectivity field
radar = pyart.testing.make_empty_rhi_radar(ngates=100, rays_per_sweep=40, nsweeps=3)
nrays = 40 * 3
ramp = np.linspace(0, 4 * np.pi, nrays)[:, None]
data = (20 + 15 * np.sin(ramp) * np.ones((nrays, 100))).astype("float32")
data = np.ma.masked_array(data, mask=False)
# Mask the far gates on every ray so despeckle_field has real gaps to work with
data.mask[:, -5:] = True
radar.fields = {"reflectivity": pyart.config.get_metadata("reflectivity")}
radar.fields["reflectivity"]["data"] = data
radar.fields["reflectivity"]["_FillValue"] = pyart.config.get_fillvalue()

# Write to CfRadial and read it back in with xradar, since there is no direct
# in-memory Radar -> DataTree conversion
with tempfile.TemporaryDirectory() as tmp_dir:
    filename = str(Path(tmp_dir) / "synthetic_rhi.nc")
    pyart.io.write_cfradial(filename, radar)
    tree = xd.io.open_cfradial1_datatree(filename)

# Give the tree Py-ART radar methods
rhi = tree.pyart.to_radar(scan_type="rhi")
Run an algorithm on the RHI volume
Despeckle the reflectivity field to remove small, isolated regions of data.
Any Py-ART algorithm accepting a Radar also accepts an Xradar
instance directly – use pyart.xradar.to_pyart_radar() only when a
function needs the coercion made explicit.
gatefilter = pyart.correct.despeckle_field(rhi, "reflectivity", size=10)

# Plot the RHI, before and after despeckling
display = pyart.graph.RadarDisplay(rhi)
fig = plt.figure(figsize=(10, 4))

ax1 = fig.add_subplot(121)
display.plot_rhi(
    "reflectivity", 0, vmin=-8, vmax=64, cmap="ChaseSpectral", ax=ax1, title="Raw"
)

ax2 = fig.add_subplot(122)
display.plot_rhi(
    "reflectivity",
    0,
    vmin=-8,
    vmax=64,
    cmap="ChaseSpectral",
    gatefilter=gatefilter,
    ax=ax2,
    title="Despeckled",
)
Total running time of the script: (0 minutes 0.263 seconds)