Note
Go to the end to download the full example code.
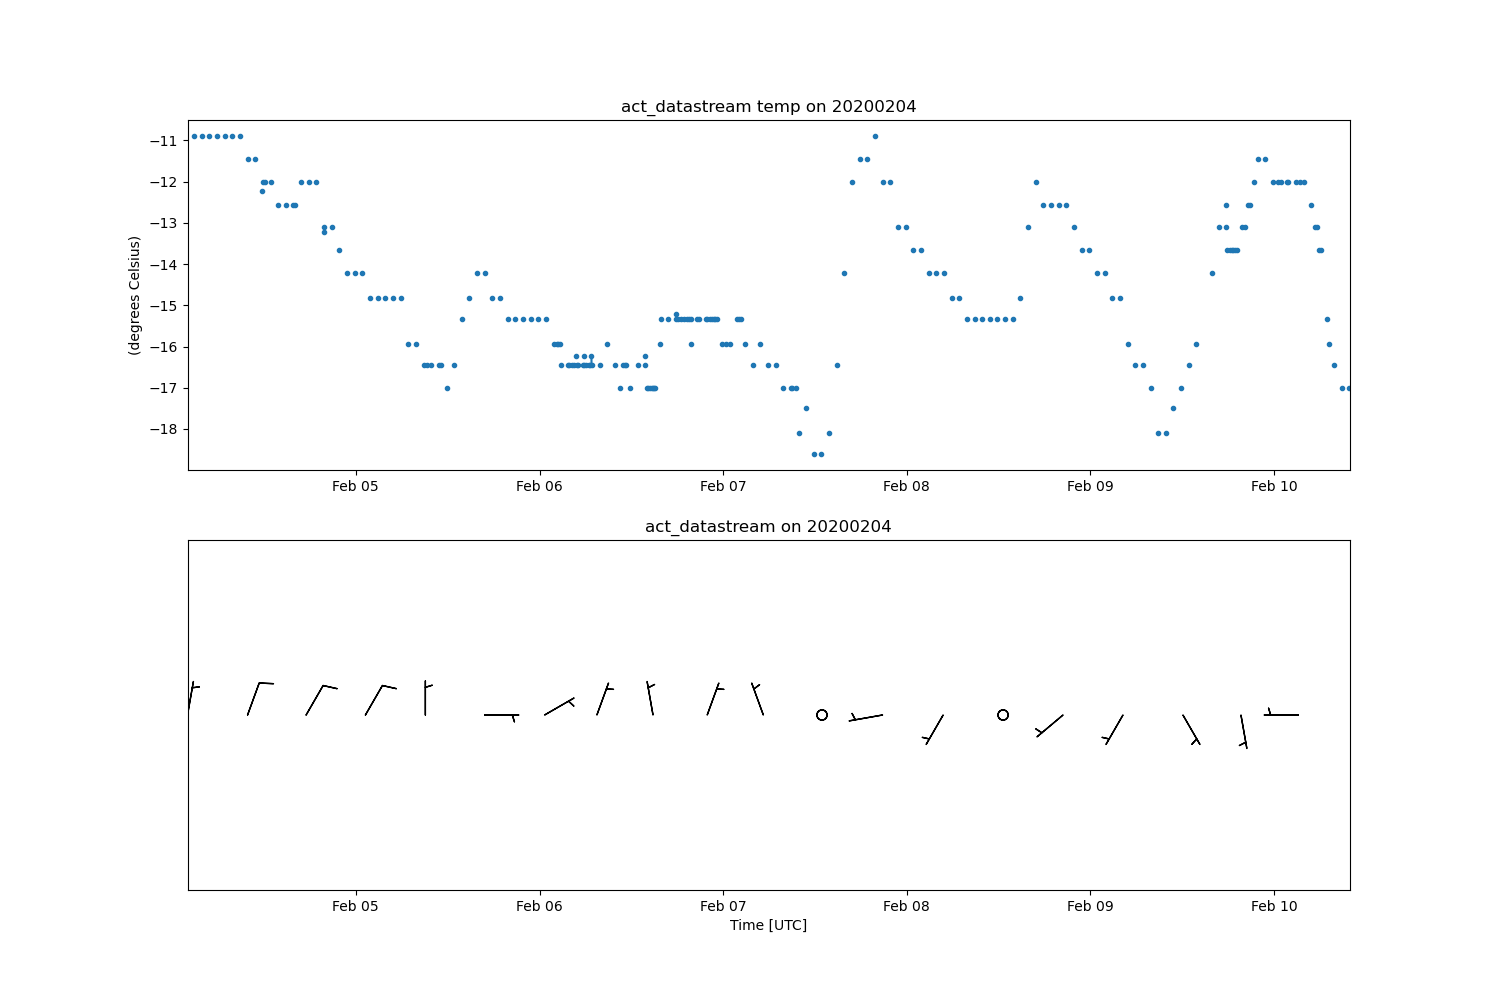
Query and plot ASOS data#
This example shows how to plot timeseries of ASOS data from Chicago O’Hare airport.
Downloading: ORD
/home/runner/work/ACT/ACT/act/plotting/plot.py:81: UserWarning: Could not discern datastreamname and dict or tuple were not provided. Using defaultname of act_datastream!
  warnings.warn(
from datetime import datetime

import matplotlib.pyplot as plt

import act

time_window = [datetime(2020, 2, 4, 2, 0), datetime(2020, 2, 10, 10, 0)]
my_asoses = act.discovery.get_asos_data(time_window, station='ORD', regions='IL')

display = act.plotting.TimeSeriesDisplay(my_asoses['ORD'], subplot_shape=(2,), figsize=(15, 10))
display.plot('temp', subplot_index=(0,))
display.plot_barbs_from_u_v(u_field='u', v_field='v', subplot_index=(1,))
display.axes[1].set_ylim([0, 2])
plt.show()
Total running time of the script: (0 minutes 1.320 seconds)