Note
Go to the end to download the full example code.
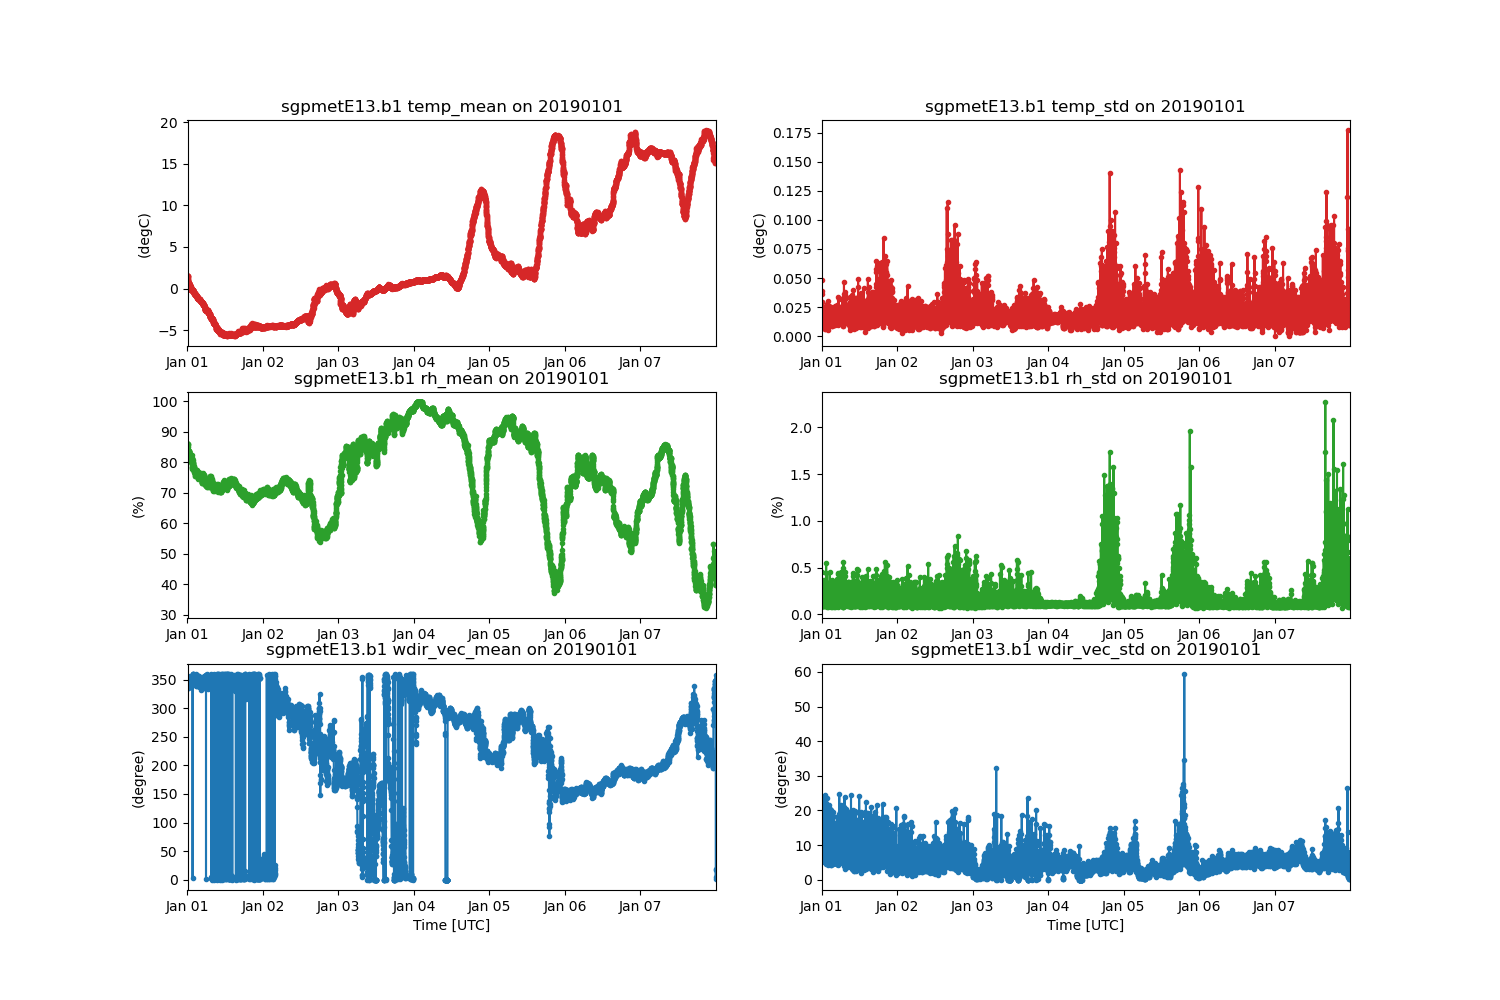
Plot a timeseries of sounding data#
This is a simple example for how to plot multiple columns in a TimeseriesDisplay.
Author: Maxwell Grover
from arm_test_data import DATASETS
from matplotlib import pyplot as plt

import act

# Read in MET files.
met_wildcard_list = [
    'sgpmetE13.b1.20190101.000000.cdf',
    'sgpmetE13.b1.20190102.000000.cdf',
    'sgpmetE13.b1.20190103.000000.cdf',
    'sgpmetE13.b1.20190104.000000.cdf',
    'sgpmetE13.b1.20190105.000000.cdf',
    'sgpmetE13.b1.20190106.000000.cdf',
    'sgpmetE13.b1.20190107.000000.cdf',
]
met_filenames = [DATASETS.fetch(file) for file in met_wildcard_list]
met_ds = act.io.arm.read_arm_netcdf(met_filenames)


# Plot data
display = act.plotting.TimeSeriesDisplay(met_ds)
display.add_subplots((3, 2), figsize=(15, 10))
display.plot('temp_mean', color='tab:red', subplot_index=(0, 0))
display.plot('rh_mean', color='tab:green', subplot_index=(1, 0))
display.plot('wdir_vec_mean', subplot_index=(2, 0))
display.plot('temp_std', color='tab:red', subplot_index=(0, 1))
display.plot('rh_std', color='tab:green', subplot_index=(1, 1))
display.plot('wdir_vec_std', subplot_index=(2, 1))
plt.show()
Total running time of the script: (0 minutes 0.659 seconds)