Note
Go to the end to download the full example code.
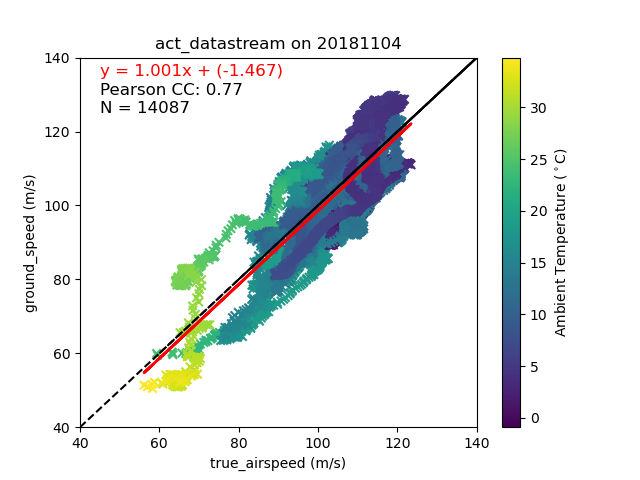
Compare Aircraft Airspeeds#
Compare Aircraft Airspeeds via the DistributionDisplay Scatter Plot
Written: Joe O’Brien
import matplotlib.pyplot as plt
import numpy as np
from arm_test_data import DATASETS
from scipy.stats.mstats import pearsonr

import act
from act.io.icartt import read_icartt

# Call the read_icartt function, which supports input
# for ICARTT (v2.0) formatted files.
# Example file is ARM Aerial Facility Navigation Data
filename_icartt = DATASETS.fetch('AAFNAV_COR_20181104_R0.ict')
ds = read_icartt(filename_icartt)

# Create a DistributionDisplay object to compare fields
display = act.plotting.DistributionDisplay(ds)

# Compare aircraft ground speed with indicated airspeed
display.plot_scatter(
    'true_airspeed',
    'ground_speed',
    m_field='ambient_temp',
    marker='x',
    cbar_label=r'Ambient Temperature ($^\circ$C)',  # noqa W605
)

# Set the range of the field on the x-axis
display.set_xrng((40, 140))
display.set_yrng((40, 140))

# Determine the best fit line
z = np.ma.polyfit(ds['true_airspeed'], ds['ground_speed'], 1)
p = np.poly1d(z)

# Plot the best fit line
display.axes[0].plot(ds['true_airspeed'], p(ds['true_airspeed']), 'r', linewidth=2)

# Display the line equation
display.axes[0].text(45, 135, f"y = {z[0]:.3f}x + ({z[1]:.3f})", color='r', fontsize=12)

# Calculate Pearson Correlation Coefficient
cc_conc = pearsonr(ds['true_airspeed'], ds['ground_speed'])

# Display the Pearson CC
display.axes[0].text(45, 130, f"Pearson CC: {cc_conc[0]:.2f}", fontsize=12)

# Display the total number of samples
display.axes[0].text(45, 125, "N = {:.0f}".format(ds['true_airspeed'].data.shape[0]), fontsize=12)

# Display the 1:1 ratio line
display.set_ratio_line()
plt.show()
Total running time of the script: (0 minutes 0.545 seconds)