Note
Go to the end to download the full example code.
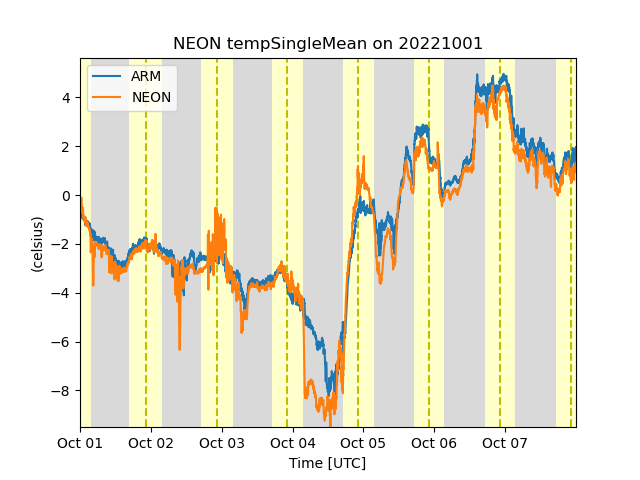
NEON Data#
This example shows how to download data from NEON and ARM 2m surface meteorology stations on the North Slope and plot them
[DOWNLOADING] nsametC1.b1.20221001.000000.cdf
[DOWNLOADING] nsametC1.b1.20221002.000000.cdf
[DOWNLOADING] nsametC1.b1.20221003.000000.cdf
[DOWNLOADING] nsametC1.b1.20221004.000000.cdf
[DOWNLOADING] nsametC1.b1.20221005.000000.cdf
[DOWNLOADING] nsametC1.b1.20221006.000000.cdf
[DOWNLOADING] nsametC1.b1.20221007.000000.cdf

If you use these data to prepare a publication, please cite:

Kyrouac, J., Shi, Y., & Tuftedal, M. Surface Meteorological Instrumentation
(MET), 2022-10-01 to 2022-10-07, North Slope Alaska (NSA), Central Facility,
Barrow AK (C1). Atmospheric Radiation Measurement (ARM) User Facility.
https://doi.org/10.5439/1786358

[DOWNLOADING]  NEON.D18.BARR.DP1.00002.001.variables.20230220T172200Z.csv
[DOWNLOADING]  NEON.D18.BARR.DP1.00002.001.sensor_positions.20230220T172200Z.csv
[DOWNLOADING]  NEON.D18.BARR.DP1.00002.001.000.010.030.SAAT_30min.2022-10.basic.20230220T172200Z.csv
[DOWNLOADING]  NEON.D18.BARR.DP1.00002.001.EML.20221001-20221101.20260123T000749Z.xml
[DOWNLOADING]  NEON.D18.BARR.DP1.00002.001.000.010.001.SAAT_1min.2022-10.basic.20230220T172200Z.csv
[DOWNLOADING]  NEON.D18.BARR.DP1.00002.001.000.020.001.SAAT_1min.2022-10.basic.20230220T172200Z.csv
[DOWNLOADING]  NEON.D18.BARR.DP1.00002.001.000.030.001.SAAT_1min.2022-10.basic.20230220T172200Z.csv
[DOWNLOADING]  NEON.D18.BARR.DP1.00002.001.readme.20260123T000749Z.txt
[DOWNLOADING]  NEON.D18.BARR.DP1.00002.001.000.030.030.SAAT_30min.2022-10.basic.20230220T172200Z.csv
[DOWNLOADING]  NEON.D18.BARR.DP1.00002.001.000.020.030.SAAT_30min.2022-10.basic.20230220T172200Z.csv
[DOWNLOADING]  NEON.D18.BARR.DP1.00002.001.variables.20230220T172200Z.csv
[DOWNLOADING]  NEON.D18.BARR.DP1.00002.001.000.020.030.SAAT_30min.2022-10.expanded.20230220T172200Z.csv
[DOWNLOADING]  NEON.D18.BARR.DP1.00002.001.000.020.001.SAAT_1min.2022-10.expanded.20230220T172200Z.csv
[DOWNLOADING]  NEON.D18.BARR.DP1.00002.001.EML.20221001-20221101.20260123T000749Z.xml
[DOWNLOADING]  NEON.D18.BARR.DP1.00002.001.sensor_positions.20230220T172200Z.csv
[DOWNLOADING]  NEON.D18.BARR.DP1.00002.001.000.010.030.SAAT_30min.2022-10.expanded.20230220T172200Z.csv
[DOWNLOADING]  NEON.D18.BARR.DP1.00002.001.000.010.001.SAAT_1min.2022-10.expanded.20230220T172200Z.csv
[DOWNLOADING]  NEON.D18.BARR.DP1.00002.001.readme.20260123T000749Z.txt
[DOWNLOADING]  NEON.D18.BARR.DP1.00002.001.000.030.001.SAAT_1min.2022-10.expanded.20230220T172200Z.csv
[DOWNLOADING]  NEON.D18.BARR.DP1.00002.001.000.030.030.SAAT_30min.2022-10.expanded.20230220T172200Z.csv
import glob
import os

import matplotlib.pyplot as plt

import act

# Place your username and token here
username = os.getenv('ARM_USERNAME')
token = os.getenv('ARM_PASSWORD')

if token is not None and len(token) > 0:
    # Download ARM data if a username/token are set
    files = act.discovery.download_arm_data(
        username, token, 'nsametC1.b1', '2022-10-01', '2022-10-07'
    )
    ds = act.io.arm.read_arm_netcdf(files)

    # Download NEON Data
    # NEON sites can be found through the NEON website
    # https://www.neonscience.org/field-sites/explore-field-sites
    site_code = 'BARR'
    product_code = 'DP1.00002.001'
    result = act.discovery.neon.download_neon_data(site_code, product_code, '2022-10')

    # A number of files are downloaded and further explained in the readme file that's downloaded.
    # These are the files we will need for reading 1 minute NEON data
    file = glob.glob(
        os.path.join(
            '.',
            'BARR_DP1.00002.001',
            'NEON.D18.BARR.DP1.00002.001.000.010.001.SAAT_1min.2022-10.expanded.*.csv',
        )
    )
    variable_file = glob.glob(
        os.path.join('.', 'BARR_DP1.00002.001', 'NEON.D18.BARR.DP1.00002.001.variables.*.csv')
    )
    position_file = glob.glob(
        os.path.join(
            '.',
            'BARR_DP1.00002.001',
            'NEON.D18.BARR.DP1.00002.001.sensor_positions.*.csv',
        )
    )
    # Read in the data using the ACT reader, passing with it the variable and position files
    # for added information in the dataset
    ds2 = act.io.read_neon_csv(file, variable_files=variable_file, position_files=position_file)

    # Plot up the two datasets
    display = act.plotting.TimeSeriesDisplay({'ARM': ds, 'NEON': ds2})
    display.plot('temp_mean', 'ARM', marker=None, label='ARM')
    display.plot('tempSingleMean', 'NEON', marker=None, label='NEON')
    display.day_night_background('ARM')
    plt.show()
Total running time of the script: (0 minutes 10.768 seconds)