Note
Go to the end to download the full example code.
Plotting flagged data gaps with a step change test#
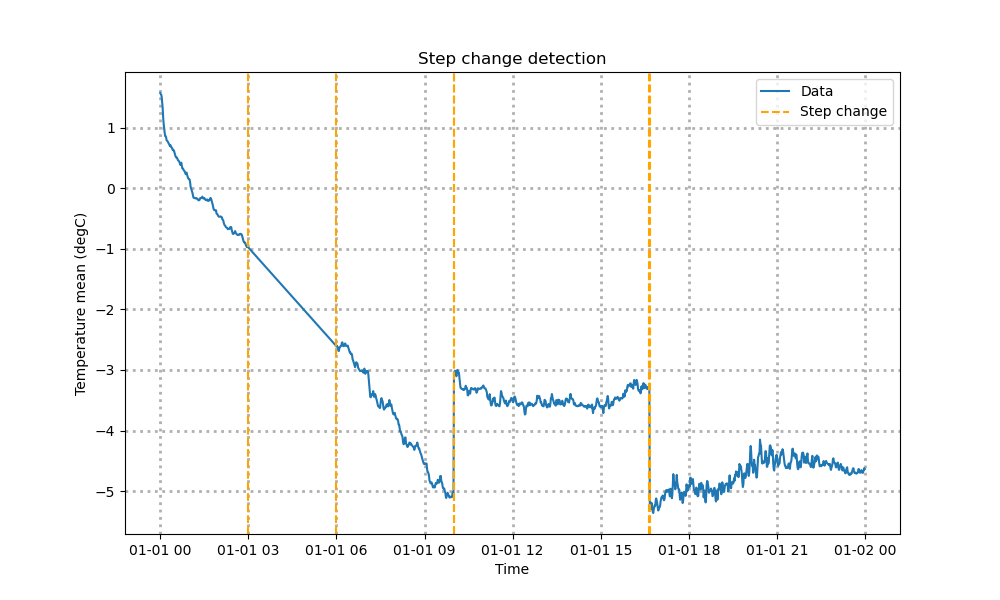
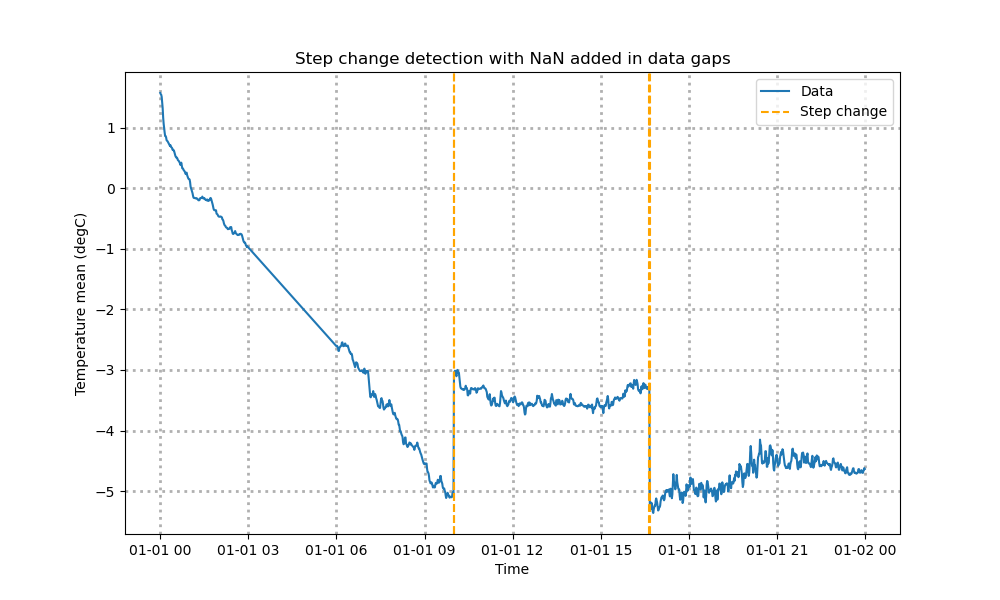
This is an example for how to use the step change detection test. The test uses the cumulative sum control chart to detect when a sudden shift in values occurs. It has an option to insert NaN value when there is a data gap to not have those periods returned as a data shift. This example produces two plots, one with the data gap flagged and one without.
Author: Ken Kehoe
import numpy as np
from arm_test_data import DATASETS
from matplotlib import pyplot as plt

from act.io.arm import read_arm_netcdf

# Get example data from ARM Test Data repository
EXAMPLE_MET = DATASETS.fetch('sgpmetE13.b1.20190101.000000.cdf')
variable = 'temp_mean'
ds = read_arm_netcdf(EXAMPLE_MET, keep_variables=variable)

# Add shifts in the data
data = ds[variable].values
data[600:] += 2
data[1000:] -= 2
ds[variable].values = data

# Remove data from the Dataset to simulate instrument being off-line
ds = ds.where((ds["time.hour"] < 3) | (ds["time.hour"] > 5), drop=True)

# Add step change test
ds.qcfilter.add_step_change_test(variable)

# Add step change test but insert NaN values during period of missing data
# so it does not trip the test.
ds.qcfilter.add_step_change_test(variable, add_nan=True)

# Make plot with results from the step change test for when the missing data
# is included and a second plot without including the missing data gap.
title = 'Step change detection'
for ii in range(1, 3):
    plt.figure(figsize=(10, 6))
    plt.plot(ds['time'].values, ds[variable].values, label='Data')
    plt.xlabel('Time')
    plt.ylabel(f"{ds[variable].attrs['long_name']} ({ds[variable].attrs['units']})")
    plt.title(title)
    plt.grid(lw=2, ls=':')

    label = 'Step change'
    index = ds.qcfilter.get_qc_test_mask(var_name=variable, test_number=ii)
    for jj in np.where(index)[0]:
        plt.axvline(x=ds['time'].values[jj], color='orange', linestyle='--', label=label)
        label = None

    title += ' with NaN added in data gaps'

    plt.legend()
    plt.show()
Total running time of the script: (0 minutes 0.171 seconds)

