Note
Go to the end to download the full example code.
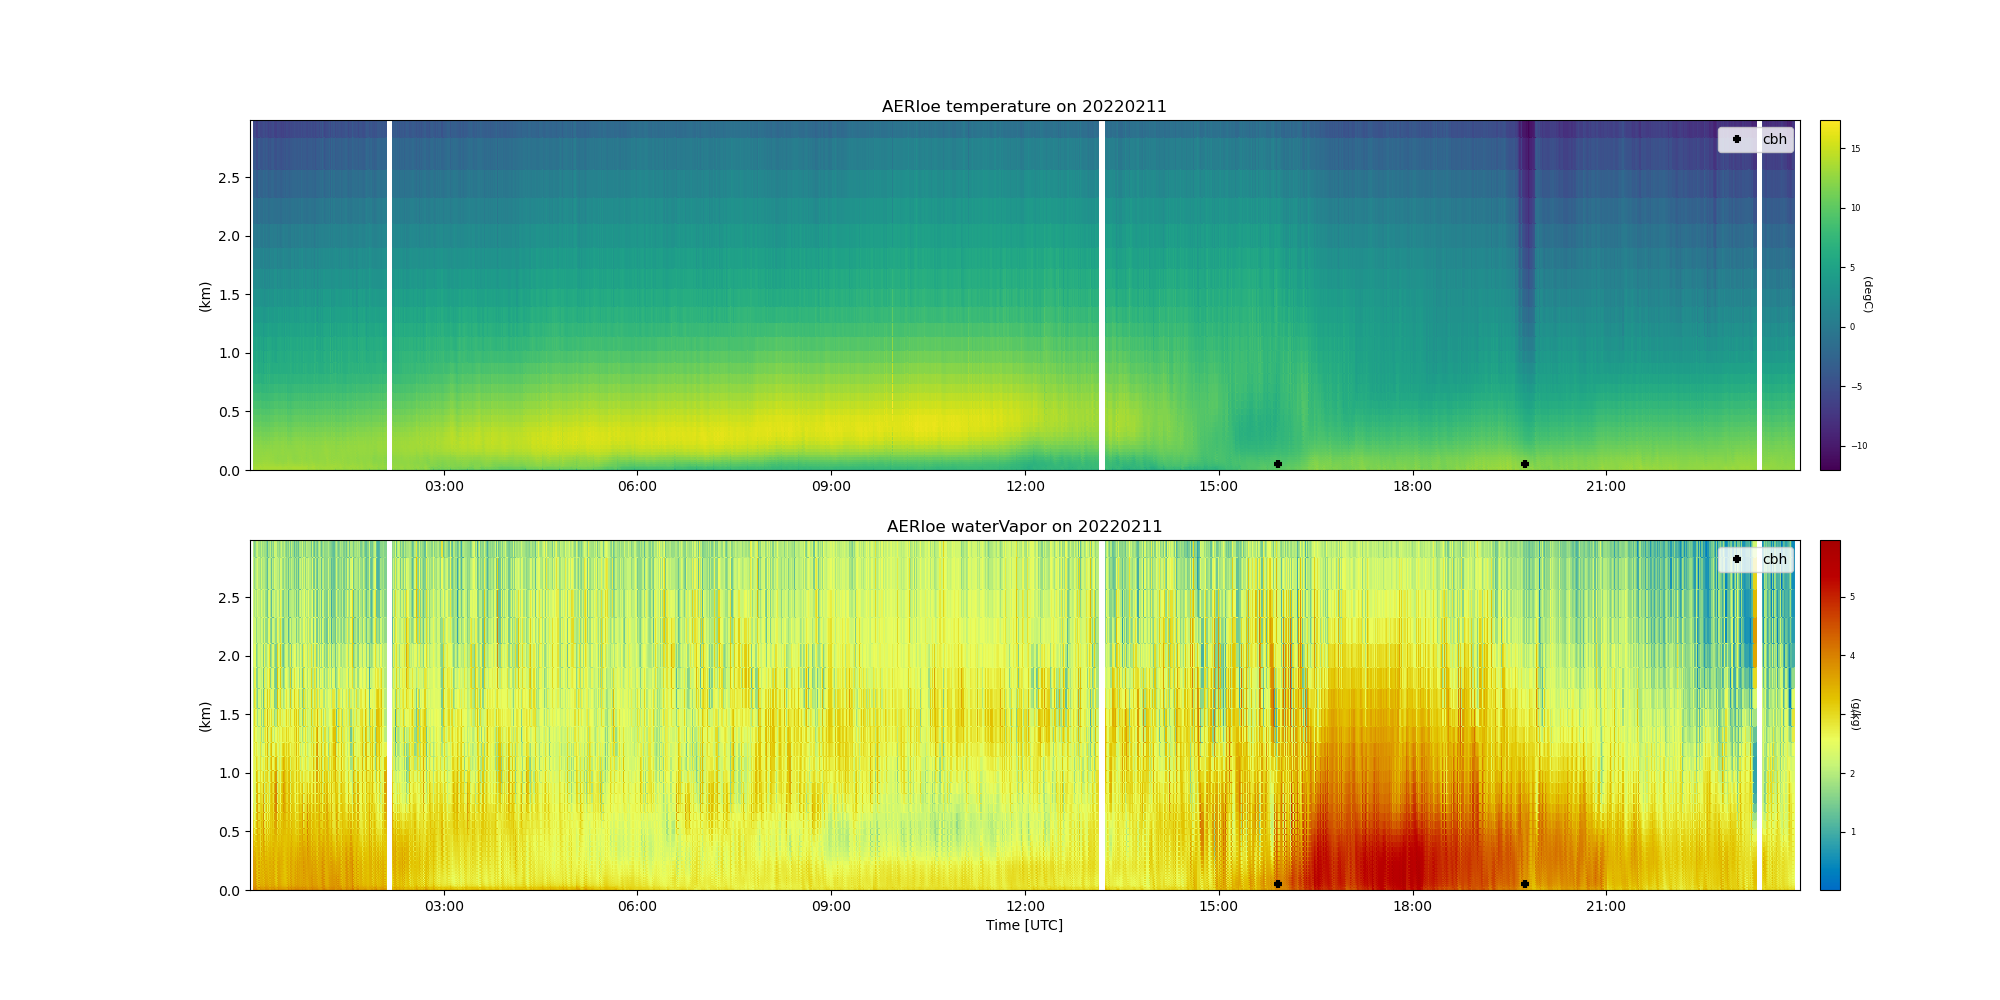
Plot AERIoe data with cloud base height from ceilometer#
Example to download and plot AERIoe temperature and water vapor overlaying ceilometer cloud base height(cbh).
[DOWNLOADING] sgpaerioe1turnC1.c1.20220211.000354.nc

If you use these data to prepare a publication, please cite:

Shippert, T., & Zhang, D. AERIoe Thermodynamic Profile and Cloud Retrieval
(AERIOE1TURN), 2022-02-11 to 2022-02-11, Southern Great Plains (SGP), Central
Facility, Lamont, OK (C1). Atmospheric Radiation Measurement (ARM) User
Facility. https://doi.org/10.5439/1483830

[DOWNLOADING] sgpceilC1.b1.20220211.000005.nc

If you use these data to prepare a publication, please cite:

Zhang, D., Ermold, B., & Morris, V. Ceilometer (CEIL), 2022-02-11 to 2022-02-11,
Southern Great Plains (SGP), Central Facility, Lamont, OK (C1). Atmospheric
Radiation Measurement (ARM) User Facility. https://doi.org/10.5439/1181954
import os

import matplotlib.pyplot as plt

import act

# Place your username and token here
username = os.getenv('ARM_USERNAME')
token = os.getenv('ARM_PASSWORD')

# Download and read AERIoe and ceilometer data
if username is None or token is None or len(username) == 0 or len(token) == 0:
    pass
else:
    results = act.discovery.download_arm_data(
        username, token, 'sgpaerioe1turnC1.c1', '2022-02-11', '2022-02-11'
    )
    aerioe_ds = act.io.arm.read_arm_netcdf(results)
    results = act.discovery.download_arm_data(
        username, token, 'sgpceilC1.b1', '2022-02-11', '2022-02-11'
    )
    ceil_ds = act.io.arm.read_arm_netcdf(results)

    # There isn't information content from the AERI above 3 km
    # Remove data with a height above 3 km
    aerioe_ds = aerioe_ds.sel(height=aerioe_ds.coords['height'] <= 3)

    # Convert Ceilometer cloud base height to km
    ceil_ds.utils.change_units(variables='first_cbh', desired_unit='km')

    # Remove first_cbh if it is higher than 3 km
    ceil_ds['first_cbh'] = ceil_ds['first_cbh'][~(ceil_ds['first_cbh'] > 3)]

    # Create a TimeSeriesDisplay object
    display = act.plotting.TimeSeriesDisplay(
        {'AERIoe': aerioe_ds, 'Ceilometer': ceil_ds}, subplot_shape=(2,), figsize=(20, 10)
    )

    # Plot data
    display.plot(
        'first_cbh',
        dsname='Ceilometer',
        marker='+',
        color='black',
        markeredgewidth=3,
        linewidth=0,
        subplot_index=(0,),
        label='cbh',
    )
    display.plot(
        'temperature',
        dsname='AERIoe',
        cmap='viridis',
        set_shading='nearest',
        add_nan=True,
        subplot_index=(0,),
    )

    display.plot(
        'first_cbh',
        dsname='Ceilometer',
        marker='+',
        color='black',
        markeredgewidth=3,
        linewidth=0,
        subplot_index=(1,),
        label='cbh',
    )
    display.plot(
        'waterVapor',
        dsname='AERIoe',
        cmap='HomeyerRainbow',
        set_shading='nearest',
        add_nan=True,
        subplot_index=(1,),
    )

    # If you want to save it you can
    # plt.savefig('sgpaerioe1turnC1.c1.20220211.png')
    plt.show()

    aerioe_ds.close()
    ceil_ds.close()
Total running time of the script: (0 minutes 20.986 seconds)