Note
Go to the end to download the full example code.
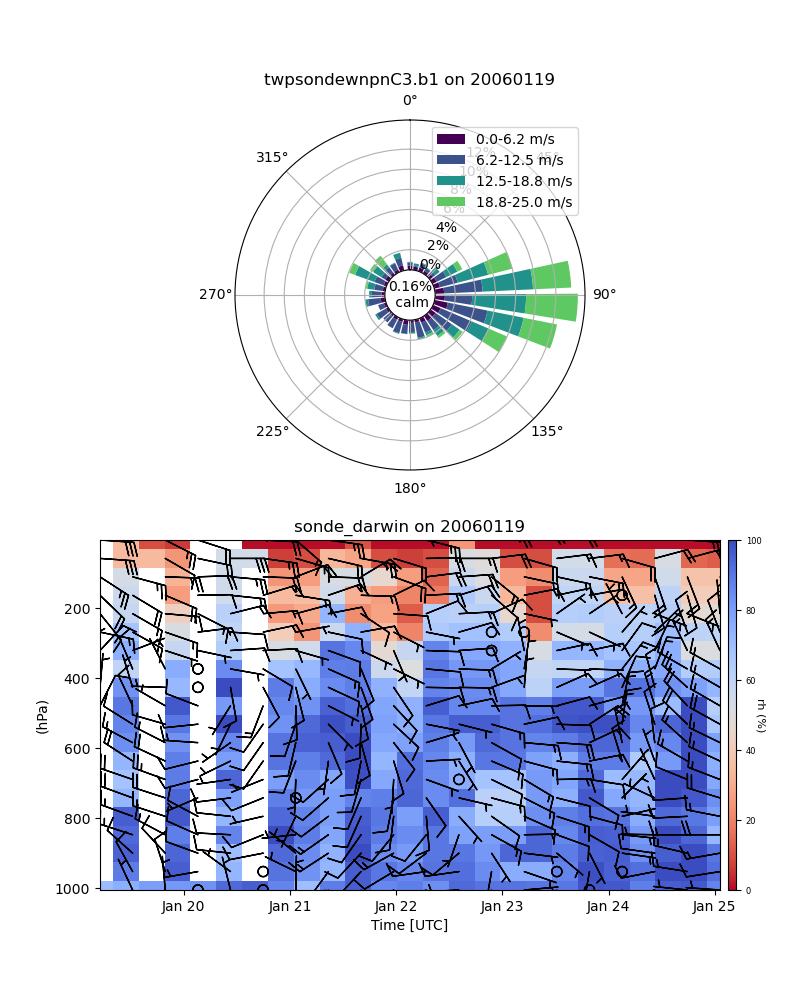
Windrose and windbarb timeseries plot#
This is an example of how to display wind rose and barb timeseries from multiple days worth of sounding data.
import numpy as np
from arm_test_data import DATASETS
from matplotlib import pyplot as plt

import act

# Read in sonde files
twp_sonde_wildcard_list = [
    'twpsondewnpnC3.b1.20060119.050300.custom.cdf',
    'twpsondewnpnC3.b1.20060119.112000.custom.cdf',
    'twpsondewnpnC3.b1.20060119.163300.custom.cdf',
    'twpsondewnpnC3.b1.20060119.231600.custom.cdf',
    'twpsondewnpnC3.b1.20060120.043800.custom.cdf',
    'twpsondewnpnC3.b1.20060120.111900.custom.cdf',
    'twpsondewnpnC3.b1.20060120.170800.custom.cdf',
    'twpsondewnpnC3.b1.20060120.231500.custom.cdf',
    'twpsondewnpnC3.b1.20060121.051500.custom.cdf',
    'twpsondewnpnC3.b1.20060121.111600.custom.cdf',
    'twpsondewnpnC3.b1.20060121.171600.custom.cdf',
    'twpsondewnpnC3.b1.20060121.231600.custom.cdf',
    'twpsondewnpnC3.b1.20060122.052600.custom.cdf',
    'twpsondewnpnC3.b1.20060122.111500.custom.cdf',
    'twpsondewnpnC3.b1.20060122.171800.custom.cdf',
    'twpsondewnpnC3.b1.20060122.232600.custom.cdf',
    'twpsondewnpnC3.b1.20060123.052500.custom.cdf',
    'twpsondewnpnC3.b1.20060123.111700.custom.cdf',
    'twpsondewnpnC3.b1.20060123.171600.custom.cdf',
    'twpsondewnpnC3.b1.20060123.231500.custom.cdf',
    'twpsondewnpnC3.b1.20060124.051500.custom.cdf',
    'twpsondewnpnC3.b1.20060124.111800.custom.cdf',
    'twpsondewnpnC3.b1.20060124.171700.custom.cdf',
    'twpsondewnpnC3.b1.20060124.231500.custom.cdf',
]
sonde_filenames = [DATASETS.fetch(file) for file in twp_sonde_wildcard_list]
sonde_ds = act.io.arm.read_arm_netcdf(sonde_filenames)

WindDisplay = act.plotting.WindRoseDisplay(sonde_ds, figsize=(8, 10), subplot_shape=(2,))
WindDisplay.plot(
    'deg', 'wspd', spd_bins=np.linspace(0, 25, 5), num_dirs=30, tick_interval=2, subplot_index=(0,)
)

BarbDisplay = act.plotting.TimeSeriesDisplay({'sonde_darwin': sonde_ds}, figsize=(10, 5))
WindDisplay.put_display_in_subplot(BarbDisplay, subplot_index=(1,))
BarbDisplay.plot_time_height_xsection_from_1d_data(
    'rh', 'pres', cmap='coolwarm_r', vmin=0, vmax=100, num_time_periods=25
)

BarbDisplay.plot_barbs_from_spd_dir('wspd', 'deg', 'pres', num_barbs_x=20)
plt.show()
Total running time of the script: (0 minutes 1.641 seconds)