Note
Go to the end to download the full example code.
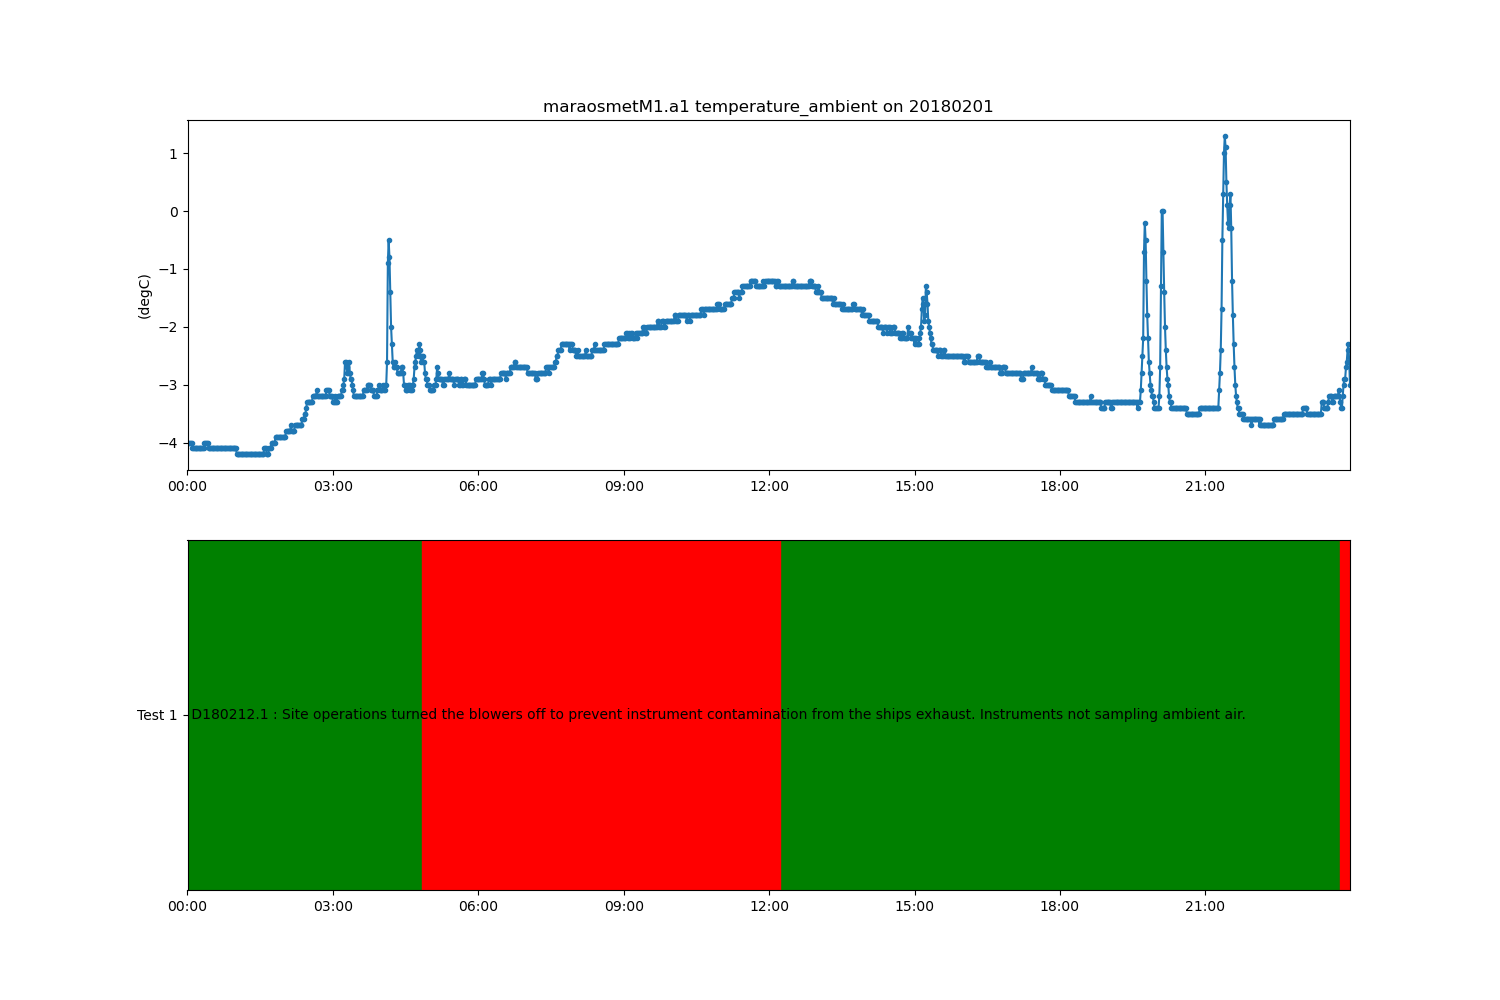
Query the ARM DQR webservice#
This example shows how to query the ARM Data Quality Report (DQR) webservice, to retrieve the machine readable DQR information. This function adds the DQR information to corresponding QC variables (qc_[variablename]) in the dataset. The example then shows how to visualize this information as we do with the normal QC variables.
Author: Adam Theisen
from arm_test_data import DATASETS
from matplotlib import pyplot as plt

import act

# Read in sample AOSMET data
filename_aosmet = DATASETS.fetch('maraosmetM1.a1.20180201.000000.nc')
ds = act.io.arm.read_arm_netcdf(filename_aosmet)

# Query DQR webservice for a specific variable
# As can be seen in the "Plotting QC Flags" example
# a call to obj.clean.cleanup() would normally be needed
# in order to plot up ARM's QC information.  In this case
# the call to add DQRs to the QC automatically applies that
# cleanup so you don't have to.
variable = 'temperature_ambient'
ds = act.qc.arm.add_dqr_to_qc(ds, variable=variable)

# Plot data
# Creat Plot Display
display = act.plotting.TimeSeriesDisplay(ds, figsize=(15, 10), subplot_shape=(2,))

# Plot temperature data in top plot
display.plot(variable, subplot_index=(0,))

# Plot QC data
display.qc_flag_block_plot(variable, subplot_index=(1,))
plt.show()
Total running time of the script: (0 minutes 0.233 seconds)