Note
Go to the end to download the full example code.
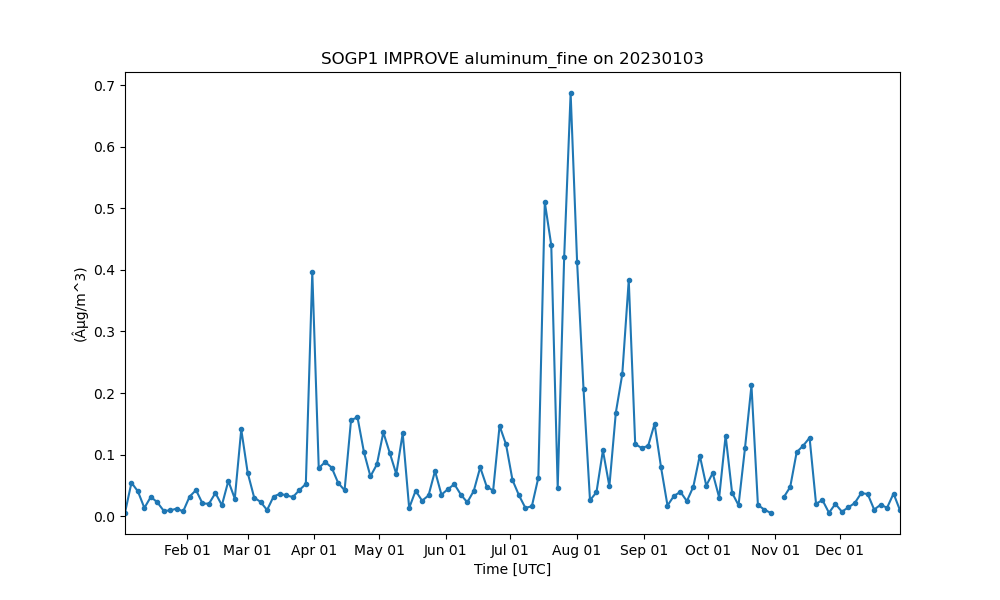
IMPROVE Data#
This example shows how to get IMPROVE data for the system located at ARM’s Southern Great Plains site.
Please use the following acknowledgment when using IMPROVE data:

IMPROVE is a collaborative association of state, tribal, and federal agencies, and international partners. US Environmental Protection Agency is the primary funding source, with contracting and research support from the National Park Service. The Air Quality Group at the University of California, Davis is the central analytical laboratory, with ion analysis provided by Research Triangle Institute, and carbon analysis provided by Desert Research Institute.
2020-12-03_Equipment Problem_4D VAC = 4.17 psi (resolved)_
2020-07-22_Part Replacement_Pump (2B)_
2020-07-21_Equipment Problem_2B pump didnt start (resolved)_
2020-07-16_UC Davis Site Visit_Calibration and maintenance on all modules_
2019-11-12_Part Replacement_Controller_
2019-10-29_Equipment Problem_Controller screen is black (resolved)_
2019-10-16_Part Replacement_Other_
2019-10-16_Part Replacement_EBox (4D)_
2019-10-07_Equipment Problem_D Module Ebox went Offline (resolved)_
import matplotlib.pyplot as plt

import act

# Pull the data using the site_id from IMPROVE
# https://views.cira.colostate.edu/adms/Pub/SiteSummary.aspx?dsidse=10001&siidse=244
# Data from the IMPROVE station next to ARM's BNF deployment
# can be found using site_id='21'
ds = act.discovery.get_improve_data(site_id='244', start_date='1/1/2023', end_date='12/31/2023')

# Remove all data that's set to the FillValue
ds = ds.where(ds['aluminum_fine'] != ds['aluminum_fine'].attrs['_FillValue'])

display = act.plotting.TimeSeriesDisplay(ds, figsize=(10, 6))
display.plot('aluminum_fine')

# Print out the known problems documented by IMPROVE
print(ds.attrs['site_problems'])

# Write out the data to netCDF and csv
ds.to_netcdf('./sgpimprove.20230101.nc')
ds.to_dataframe().to_csv('sgpimprove.20230101.csv')

plt.show()
Total running time of the script: (0 minutes 2.189 seconds)